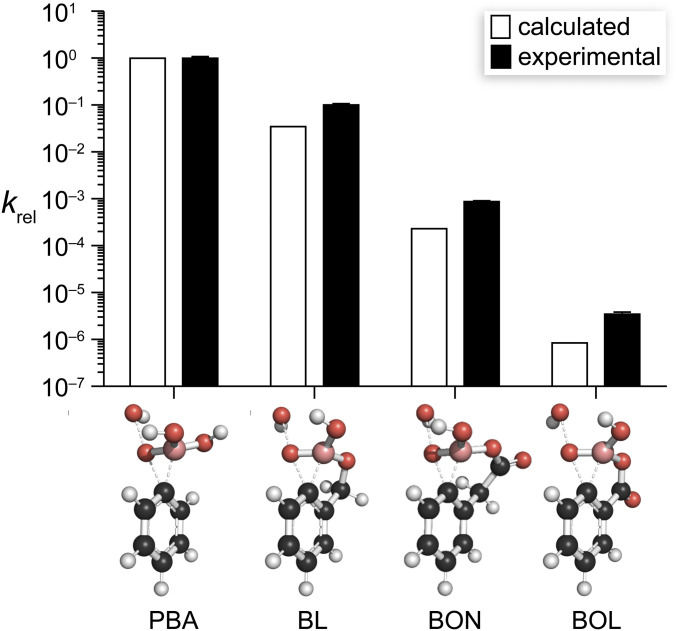
Fig. 5.
Graph of experimental and calculated relative rate constants for the oxidation of the monoanionic forms of PBA, BL, BON, and BOL by hydrogen peroxide. Images show the calculated structure of the transition states for the rate-limiting 1,2-aryl shift during the oxidation reaction. Structures were optimized at the M06-2X/6–311+G(d,p) level of theory using the IEFPCM solvation model. Values of kmonoanion are listed in SI Appendix, Table S12.

