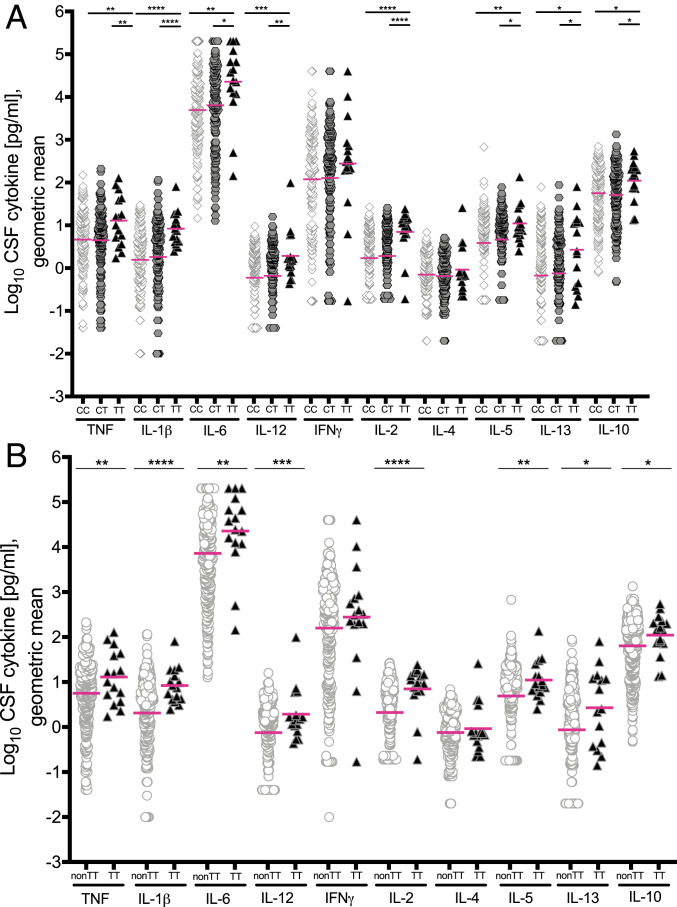
Fig. 1.
CSF cytokine levels grouped by LTA4H genotype. (A) Cytokine levels in CSF from CC (n = 148), CT (n = 142), and TT (n = 16) patients. (B) Cytokine levels compared between non-TT (n = 290) and TT (n = 16) genotypes. Magenta lines indicate geometric means. Asterisks indicate probability that right-hand group values are significantly greater than the left (* ≥ 0.95, ** ≥ 0.99, *** ≥ 0.999, **** ≥ 0.9999). Unspecified comparisons are not significant.

