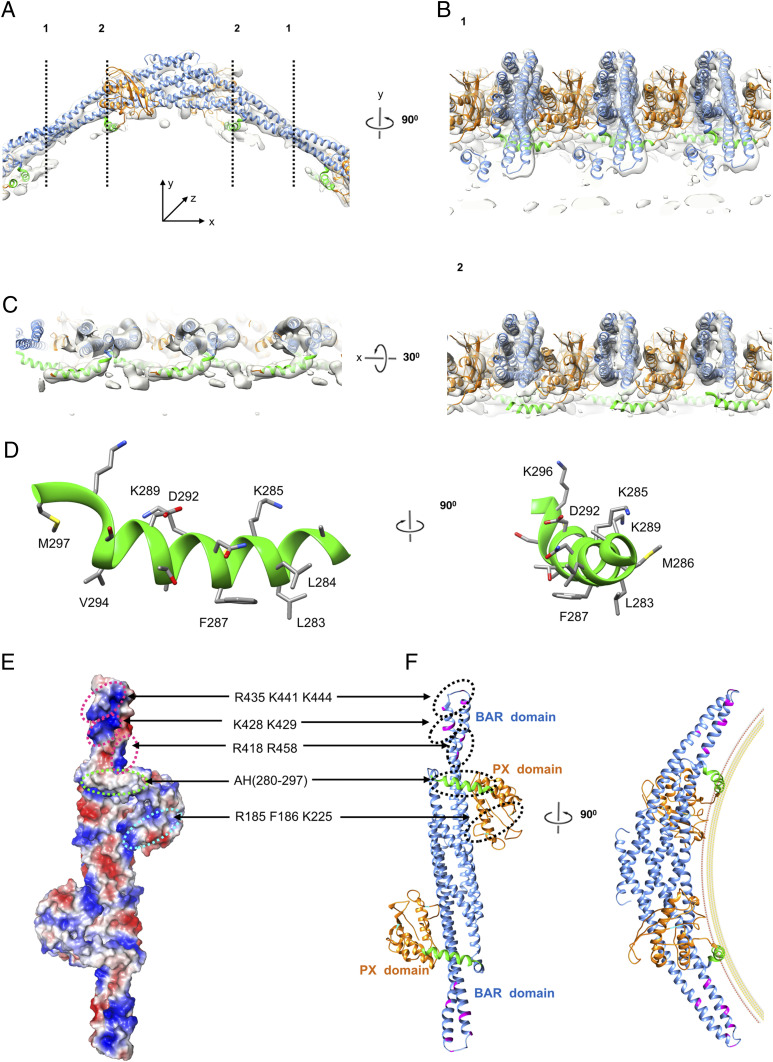
Fig. 3.
An amphipathic helix on the membrane interaction surface of SNX1. (A) Ribbon model of the SNX1 dimer interacting with the membrane. The colors of the PX and BAR domains are the same as shown in Fig. 2E. The amphipathic helix is highlighted in green. Dashed black lines denote cross sections that are rotated by 90° and shown in B. (B) Corresponding cross sections of the tube along the dashed black lines 1 and 2 in A; shown is the fitness between the structural model and the map with high threshold. (C) The cross section rotated by 30° from that shown in B, which provides the view from the membrane. (D) Ribbon model of the amphipathic helix, with charged surface on one side and hydrophobic surface on the other side and key residues labeled. (E) Electrostatic surface representation on the concave surface of SNX1, with positive charges colored blue and negative charges colored red. Positively charged patches and other areas implicated in membrane binding and tubulation are labeled. (F) A Ribbon model of SNX1 with the location of charged patches in the BAR domain shown in magenta, the amphipathic helix shown in green, and the predicted PIP3 binding site of the PX domain shown in cyan. A hypothetical membrane is depicted based on the diameter (∼40 nm−1) of tubules observed in EM maps.

