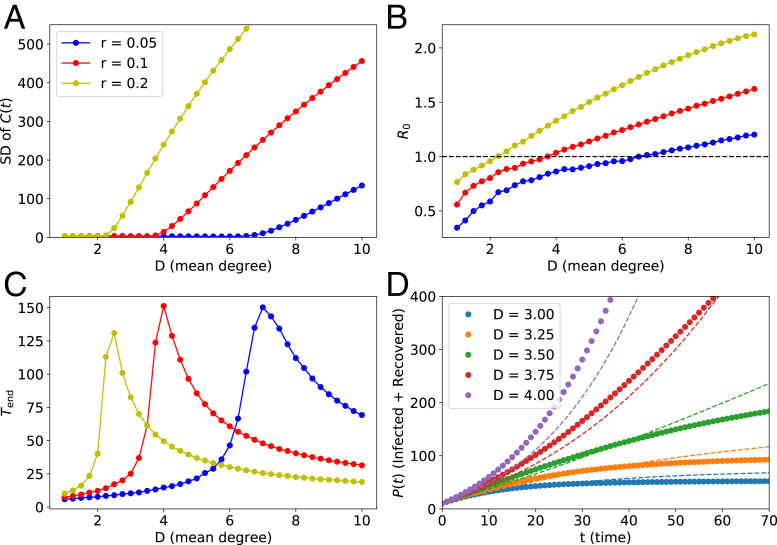
Fig. 1.
Statistics obtained via computer simulations of the epidemic spread on Poisson small-world random contact networks, defined in ref. 1. Parameters are the same as in figure 3A in ref. 1 (, , and ). The simulation starts from 10 randomly infected nodes. All statistics were obtained by averaging over realizations of the process, each with an independent realization of the random graph. (A) The SD of daily cases; this panel confirms that we reproduce results from ref. 1 (see their figure 3A). In ref. 1, the low regions are interpreted as linear growth regimes. (B) The basic reproduction number as a function of the average degree of the network. The dashed line represents the critical value . Below the critical point, the outbreak dies out exponentially; our numerical estimates confirm in this regime. (C) The outbreak duration , that is, the average time elapsed between the onset of an epidemic and its end (defined as the first time at which there are no infected nodes in the population). We observe a sharp peak around the critical point, confirming that the slow dynamics, consistent with a linear growth, is only possible around the critical point. (D) The cumulative numbers of infections as a function of time (here ). The dashed lines in D were obtained from the corresponding effective classical SIR models, which assume continuous time and homogeneous mixing. Although the match is not perfect, the classical model can reproduce qualitative features of the network model studied in ref. 1.

