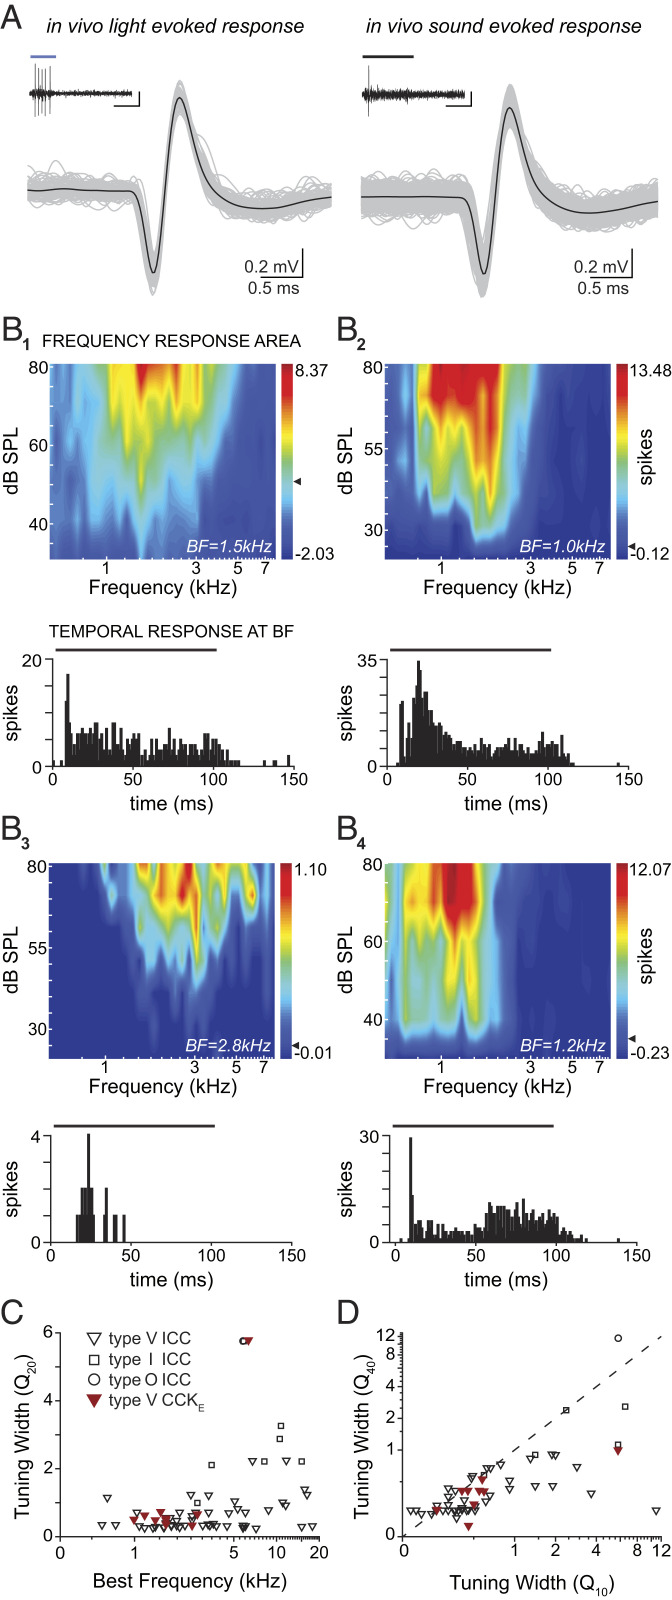
Fig. 6.
CCKE neurons recorded in vivo have uniform V-shaped FRAs and diverse temporal responses to tones. (A) Examples of light-evoked (Left, 50 ms blue light) and sound-evoked (Right, 100 ms 1.5 kHz pure tone at 70 dB sound pressure level [SPL]) voltage traces from one CCKE unit. Action potentials from light or sound presentations from the respective experiment are aligned and overlaid (gray traces, 103 light-evoked and 1,106 sound-evoked action potentials); black traces, average waveform). Insets: Example spike train from one stimulus presentation. (Scale bars: 0.3 mV, 50 ms.) (B) Example FRAs from four CCKE neurons (B1 through 4) and their associated peristimulus time histograms (PSTHs) are shown below each respective FRA. PSTHs were acquired from spike counts (2-ms bin width) at each neuron’s best frequency (BF) stimulation at all sound levels tested. The bar above each PSTH indicates tone duration (100 ms). (C) Measurements of tuning sharpness as a function of frequency. BF and the FRA Q20 values for all recorded units. CCKE neurons (red) had V-shaped receptive fields. One V-shaped unit was narrower at its tip than others (indicated by a high Q20 value) but had a wide low-frequency tail. The sampling of CCKE neurons was restricted to low and midfrequency regions of the ICC due to limited light penetration and virus injection location. (D) Measurements of the shape of FRA curves. Q10 is plotted against Q40 for each unit. Symbols below the dashed line indicate a widening of the FRA. All FRAs of CCKE neurons widened with increasing sound level, which is a reflection of their V-shaped tuning.

