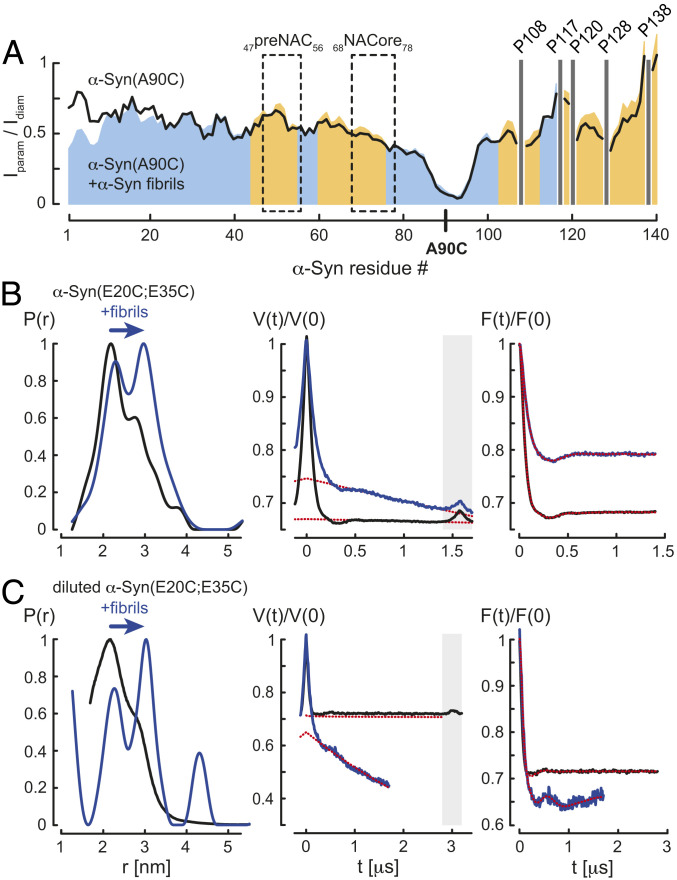
Fig. 3.
Unfolding of fibril-bound α-Syn. (A) Residue-resolved PRE intensity profiles Iparam/Idiam of para- (Iparam) and diamagnetic (Idiam) labeled α-Syn(Α90C) in the absence (black) and presence of 5.4-fold molar excess of α-Syn fibrils (blue) at pH 7. Regions with increased Iparam/Idiam values in presence of α-Syn fibrils compared to soluble α-Syn(Α90C) are colored in orange. The preNAC and NACore regions of α-Syn are highlighted. Positions of C-terminal α-Syn proline residues without peptide amide resonances are shown in one-letter amino acid code. (B) EPR measurements of MTSL-labeled α-Syn(E20C;E35C) and (C) partially MTSL-labeled α-Syn(E20C;E35C) in the absence (black) and presence (blue) of α-Syn fibrils, monomer:fibril molar ratio 1:10, at pH 7. From left to right, distance distributions P(r) using DeerAnalysis2019, primary Q-band DEER data V(t)/V(0), and background-corrected form factors F(t)/F(0) are shown including homogeneous background fits (red dotted lines). Time traces within the gray boxes were excluded from the background.

