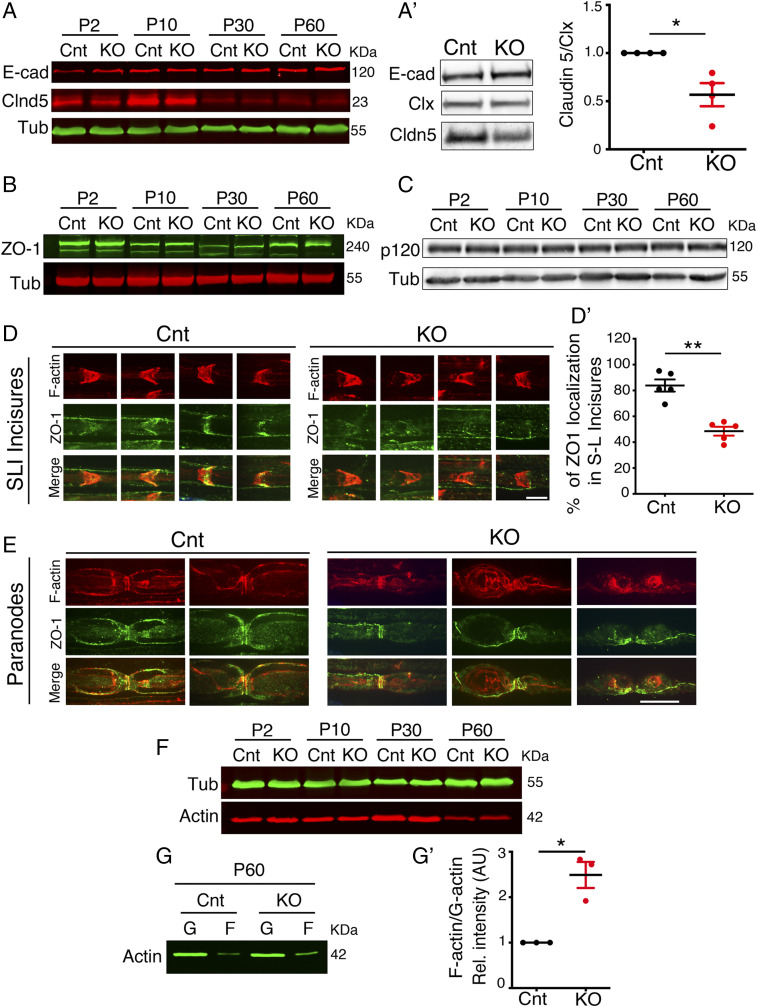
Fig. 3.
Altered expression and localization of noncompact myelin markers in Mtmr2 KO nerves. (A–C) Western blot analysis of total nerve lysates from Mtmr2 KO and wild-type control mice (Cnt) at different stages of postnatal development shows that expression levels of E-cadherin, ZO-1, and p120 catenin are similar between mutant and control. Claudin 5 (Cldn5) expression level was decreased in Mtmr2 KO sciatic nerve lysates at P10 and P30 as quantified in SI Appendix, Fig. S2H. (A′) Western blot analysis performed on membrane fraction lysates from Mtmr2 KO nerves at P30 confirmed reduced expression levels of claudin 5 in mutant nerves, as quantified in n = 4 independent experiments, one-sample t test, *P = 0.0366, t = 3.606, df = 3. Clx is calnexin used to normalize membrane fraction lysates (SI Appendix, Fig. S3 A–D′). (D) Teased fibers analysis of sciatic nerves shows that ZO-1 localization at SLIs was decreased in Mtmr2 KO nerves at P60. SLIs were stained with phalloidin (F-actin), n = 5 animals per genotype in five different experiments; two-tailed Mann–Whitney U test, **P = 0.008. (E) Teased fibers analysis of sciatic nerves shows that ZO-1 localization at paranodal regions is similar in Mtmr2 KO and control nerves at P60. Paranodes were stained with phalloidin (F-actin). Note that ZO-1 localizes at paranodes also in Mtmr2 KO fibers carrying myelin outfoldings. (F) Western blot analysis of lysates from Mtmr2 KO nerves and wild-type controls (Cnt) at different stages of postnatal development indicates that expression levels of actin are similar between mutant and control, as quantified in SI Appendix, Fig. S3 E and E′. (G) Western blot analysis performed from Mtmr2 KO nerves at P60 following fractionation of F (polymerized) and G (globular, monomeric) actin shows that the F-actin fraction is increased in mutant nerves, as quantified in G′ with n = 3 independent experiments, one-sample t test, *P = 0.0351, t = 5.196, df = 2 (SI Appendix, Fig. S3F). (Scale bar, 8 µm in D and 11 µm in E.)

