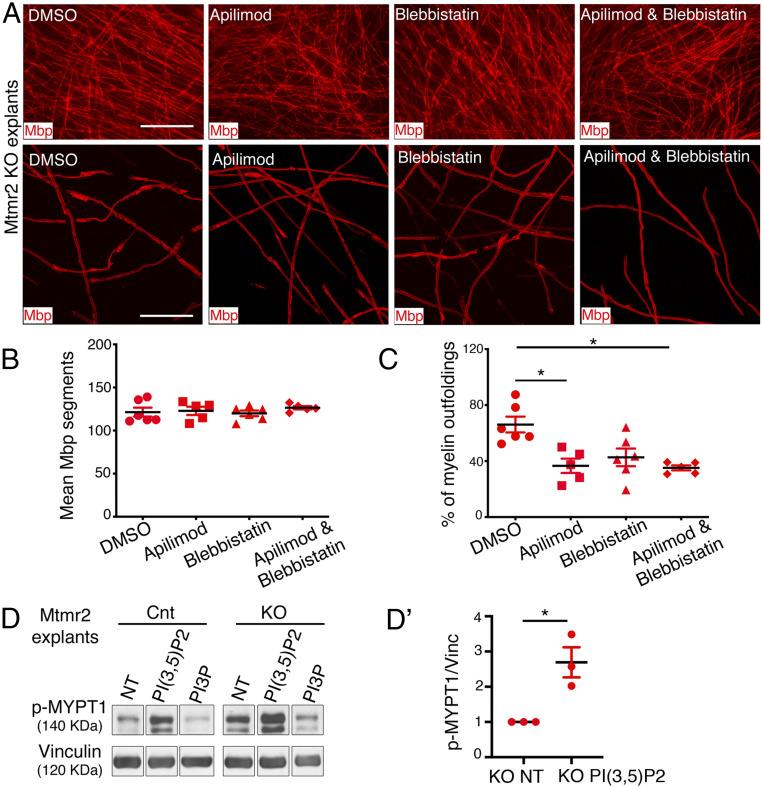
Fig. 6.
Enhanced PtdIns(3,5)P2 triggers RhoA-myosin II activation. (A) Representative fluorescence microscope images (Upper) and confocal microscope images (Lower) of Mtmr2 KO Schwann cell/DRG neuron coculture explants treated for 14 d in differentiating conditions with DMSO, apilimod, blebbistatin, and apilimod plus blebbistatin and stained for Mbp. (B) Quantification of the Mbp-positive segments in the Mtmr2 KO Schwann cell/DRG neuron coculture explants treated as indicated for 14 d in differentiating conditions. DMSO-treated, n = 6 DRG/coverslips; apilimod-treated, n = 5 DRG/coverslips; blebbistatin-treated, n = 6 DRG/coverslips, and apilimod plus blebbistatin-treated, n = 5 DRG/coverslips, nonparametric one-way ANOVA followed by Dunn's post hoc test, P = 0.6520, representative of two independent experiments. (C) Quantification of the number of Mbp-positive fibers carrying myelin outfoldings on the total number of Mbp-positive fibers analyzed. DMSO-treated, n = 6 DRG/coverslips, 210 fibers; apilimod-treated, n = 5 DRG/coverslips, 204 fibers; blebbistatin-treated, n = 6 DRG/coverslips, 218 fibers, and apilimod plus blebbistatin-treated, n = 5 DRG/coverslips, 206 fibers analyzed, nonparametric one-way ANOVA followed by Dunn's post hoc test, *P = 0.0107, representative of two independent experiments. DMSO and apilimod, *P = 0.04; DMSO and apilimod plus blebbistatin, *P = 0.018. (D) Western blot analysis of wild-type control and Mtmr2 KO Schwann cell/DRG neuron coculture explant lysates following treatment with C4-PtdIns(3,5)P2 or C4-PtdIns3P phosphoinositides. Phosphorylation levels of MYPT1 are increased in Mtmr2 KO as compared to control and PtdIns(3,5)P2 treatment further increases phosphorylation, as quantified in D′, n = 3 independent experiments, one-sample t test, one tail, *P = 0.029 (SI Appendix, Fig. S5E). Mbp, myelin basic protein. (Scale bar in A, Upper, 124 μm [fluorescence microscope images] and Lower, 46 μm [confocal microscope images].)

