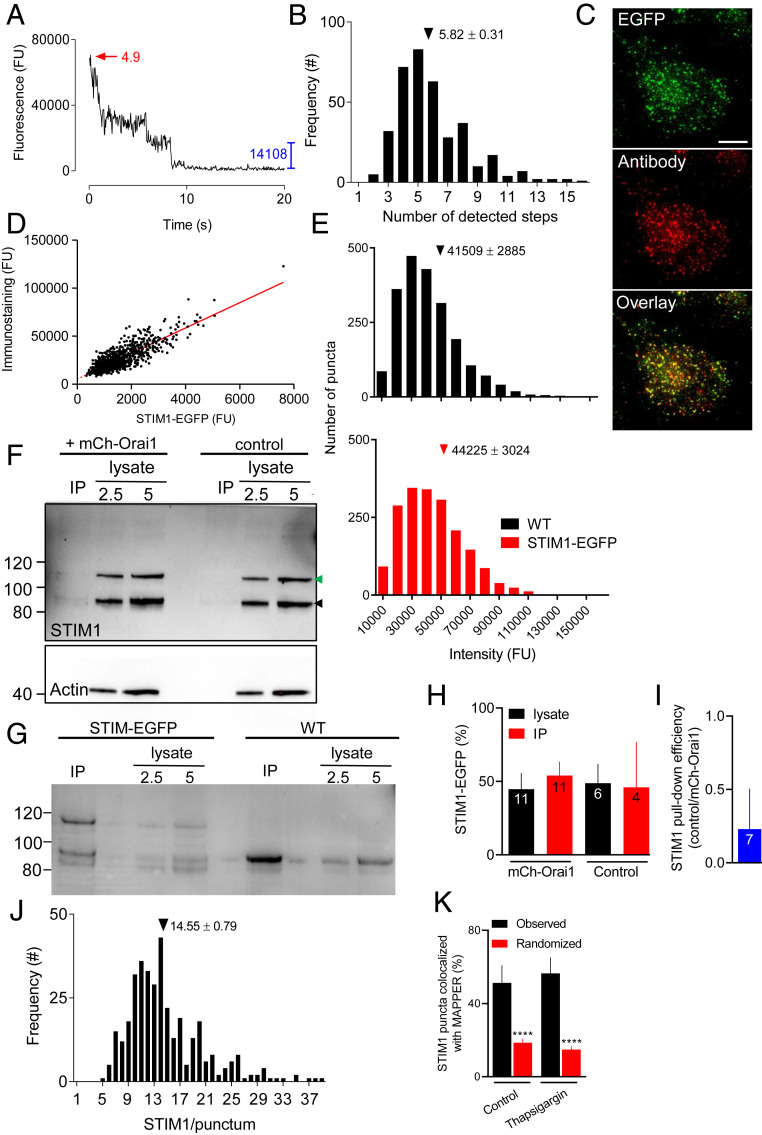
Fig. 3.
STIM1 and STIM1-EGFP form small puncta after store depletion. (A) Typical example of a photobleaching sequence for a STIM1-EGFP punctum in a cell with empty Ca2+ stores shows amplitude of the final step (blue) and estimated number of steps (red). Further examples in SI Appendix, Fig. S4B. (B) Frequency distribution for the number of bleaching steps from STIM1-EGFP puncta in cells with empty Ca2+ stores. Results are from 365 puncta distributed across 5 cells. Mean number of steps/punctum (± SEM) is shown. (C) TIRF images of STIM1-EGFP HeLa cells with empty Ca2+ stores immunostained for STIM1 (AbRa594). (Scale bar, 10 µm.) Manders coefficient for overlap of immunostaining with EGFP = 0.72 ± 0.03 (mean ± SD, n = 6 cells). (D) Summary results (804 puncta from 5 cells, with 37.9 ± 5.0% of cell areas analyzed) show linear relationship between fluorescence from EGFP and immunostaining (least-squares linear correlation coefficient, r = 0.834, P < 0.0001). (E) Frequency distribution of fluorescence intensities of immunostained STIM1 puncta within the entire TIRF footprint in WT (2,116 puncta, 5 cells) and STIM1-EGFP HeLa cells (1,891 puncta, 5 cells). Mean intensities (± SEM) are shown. P > 0.05, Student’s t test. (F) Typical WB for STIM1 (actin in Lower) shows immunoreactivity in cell lysates (2.5 and 5 µg protein) and after IP of mCh-Orai1 with RFP-Trap from STIM1-EGFP HeLa cells with or without (control) expression of mCh-Orai1. Cells were treated with thapsigargin (1 µM, 15 min in Ca2+-free HBS) before IP. Positions of molecular mass markers (kDa) are shown. Arrows indicate STIM1 and STIM1-EGFP. For cells expressing mCh-Orai1, recoveries (IP/lysate) were 27 ± 18% (mCh-Orai1, mean ± SD, n = 8) and 3.6 ± 5.8% (STIM1, n = 11). (G) Similar IP analysis comparing WT and STIM1-EGFP HeLa cells expressing mCh-Orai1 confirms that the upper band reports STIM1-EGFP. (H) Summary shows amount of STIM1-EGFP relative to all STIM1 (%) in lysates and IP for cells with and without mCh-Orai1. Mean ± SD for indicated n (values for IP in control cells report only those with detectable STIM1; 4 from 6 WB). (I) Although the STIM1-EGFP to all-STIM1 ratio (∼50%) was indistinguishable in control and cells expressing mCh-Orai1, the efficiency of the pull-down of STIM1 was much greater in cells expressing mCh-Orai1. Results show the relative pull-down efficiencies of STIM1 (control/mCh-Orai1 cells) in paired analyses. Mean ± SD, n = 7. The results establish that while the IP does not eliminate nonspecific pull-down of STIM1, the pull-down is significantly greater in cells expressing mCh-Orai1. (J) Frequency distribution of the estimated number of STIM1 molecules per punctum in cells with empty Ca2+ stores (from B). Mean number of STIM1/punctum (± SEM) is shown. (K) Colocalization of STIM1-EGFP with mCh-MAPPER puncta (centroid separations < 320 nm) in control and thapsigargin-treated cells. Mean ± SD, n = 6 cells; ****P < 0.0001, Student’s t test relative to observed. See also SI Appendix, Figs. S4–S8.

