Fig. 1.
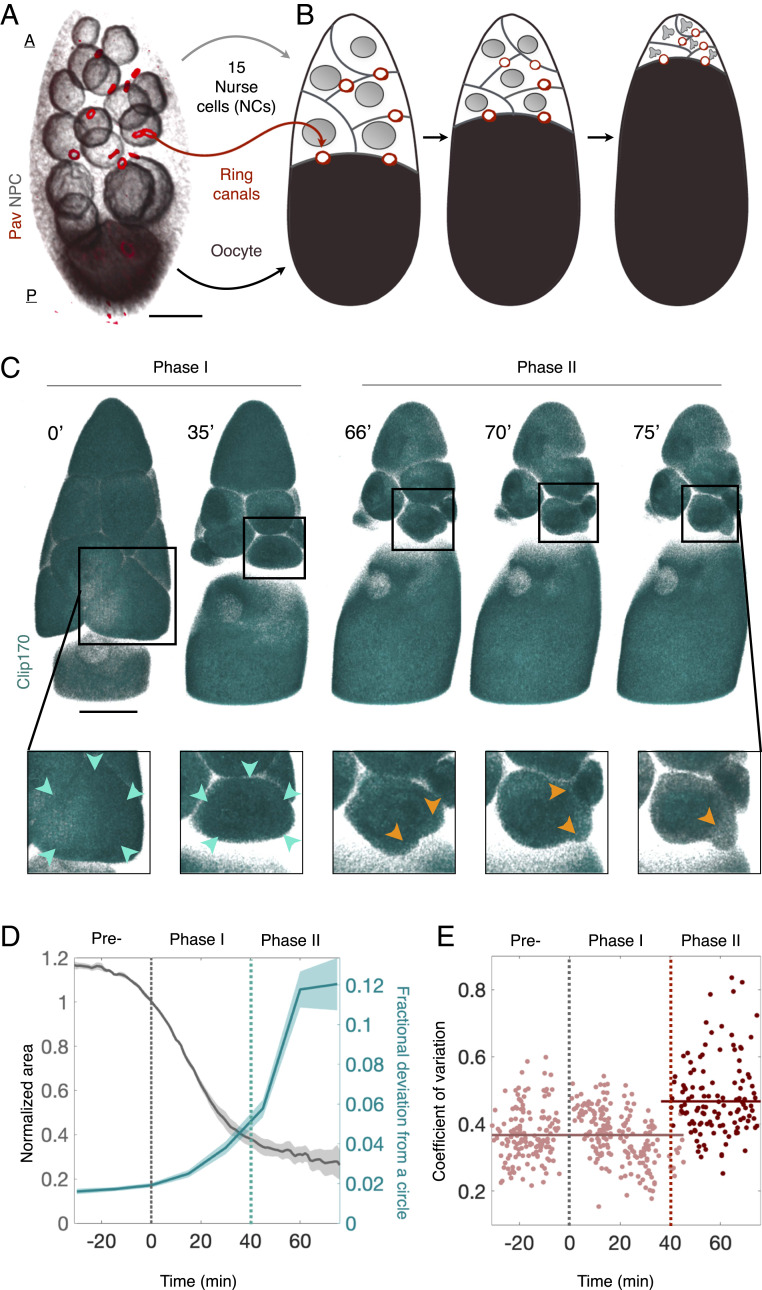
NC dumping occurs in two phases. (A) Three-dimensionally rendered confocal image of an egg chamber showing 15 anterior (A) NCs (gray: nuclear pore complex, NPC) and one posterior (P) oocyte (black: NPC) connected through ring canals (red: Pavarotti, Pav). (B) Schematic illustration of NC dumping: NCs shrink as their cytoplasm flows into the oocyte through ring canals. (C) Three-dimensionally rendered time-lapse confocal images of an egg chamber expressing Clip170::GFP undergoing NC dumping. Blowups show an NC first shrinking uniformly (cyan arrowheads; Phase I) before undergoing spatially nonuniform shape deformations and bleb-like protrusions (orange arrowheads; Phase II) that imply increased actomyosin contractility. (Scale bar in A and C: 40 m.) (D) Quantification of changes in cell size (gray) and shape (i.e., fractional deviation from a circle; SI Appendix, Fig. S2 C and D) prior to NC dumping (Pre-) and during Phases I and II. Onset of nonuniform deformations (dashed cyan line) occurs 40 min into NC dumping (n = 4). (E) Coefficient of variation of cortical Sqh intensity during NC dumping, showing a transition (dashed red line) from uniform (n = 412; Phase I) to nonuniform (n = 122; Phase II) distribution at 40 min, concomitant with the onset of dynamic cell shape deformations.

