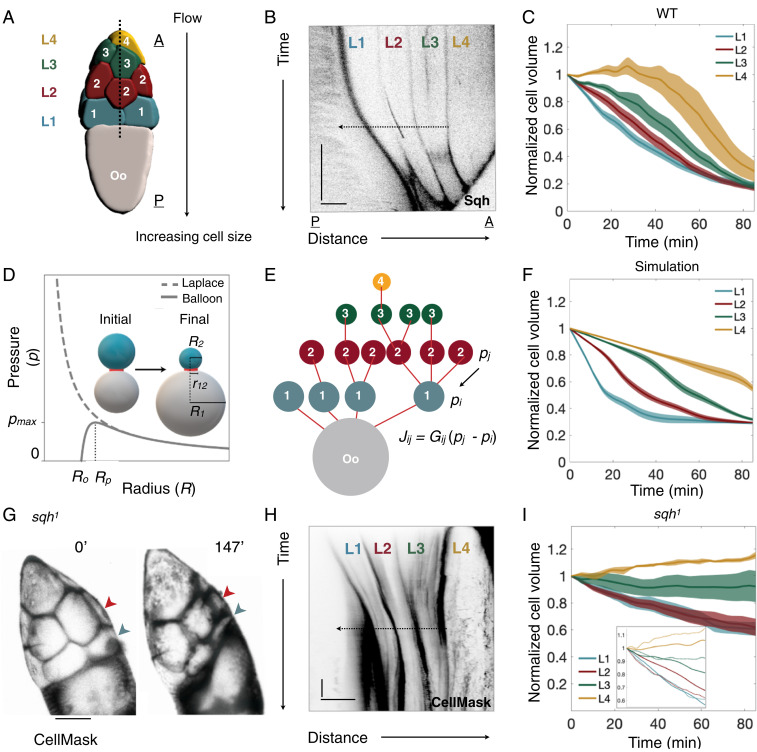
Fig. 2.
NC dumping dynamics are explained by a pressure-driven networked-flow model. (A) Three-dimensional reconstruction of a germline cyst showing the NCs’ arrangement into four layers relative to the oocyte (Oo). During NC dumping, cytoplasm flows in the direction of increasing cell size, from anterior (A) to posterior (P). (B) Kymograph of Sqh intensity in WT along the dashed line shown in A, illustrating hierarchical onset of NC dumping across the four NC layers (L1 to L4); arrow indicates direction of flow. (Scale bars: 30 min, 50 m; black indicates highest intensity.) (C) Plot of normalized NC volumes () during NC dumping for each layer from live imaging; is onset of NC dumping; solid line indicates average; envelopes show standard error (n = 15, 12, 9, and 5 cells for layers 1, 2, 3, and 4, respectively). (D) Plots of Young–Laplace’s law and the corrected pressure law for elastic balloons. Pressure is at its maximum, , at radius ; is the uninflated balloon radius; is the radius of the pipe connecting balloons 1 and 2. Schematic illustrates the two-balloon problem, where the smaller balloon (cyan) empties into the larger balloon (gray). (E) Network representation of the germline cyst in A showing cells’ relative sizes and connections; cells are shown as nodes and ring canals as edges. (F) Plot of normalized NC volumes from simulations of fluid flow in the germline cyst using the best fit parameter set (solid line); envelopes show standard error constructed from the 10 nearest sets in parameter space (n = 11). Time is scaled by the physical constants of the model. (G) sqh germline mutant showing NCs in the first (blue arrowhead) and second (red arrowhead) layers emptying into the oocyte. (H) Kymograph of intensity of CellMask (a membrane marker) in sqh mutants, showing transport of cytoplasm from the first two layers. (Scale bars: 30 min, 70 m.) (I) Plot as in C of normalized NC volumes over time in sqh germline clones; n = 14, 17, 7, and 6 cells for layers 1, 2, 3, and 4, respectively. (Inset) WT cell volume trajectories from C (solid lines), rescaled in time and overlaid with sqh mutant data (dashed lines), demonstrating slower yet hierarchical intercellular transport.

