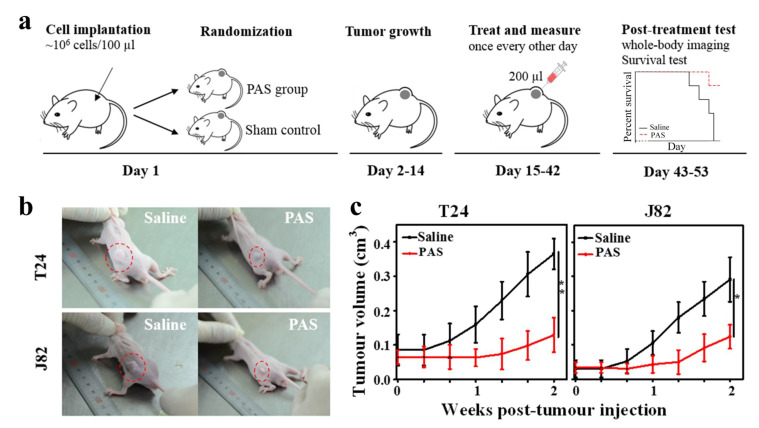
Figure 2.
(a) Sketch map of saline and plasma-activated saline (PAS) injection in nude mice bearing tumors. (b) Typical image of mice with tumors for saline and PAS injection after 28 days. (c) Time-dependent changes in the tumor volume in xenograft models for saline and PAS injection after 14 days (n = 5) (* p < 0.05, ** p < 0.01).

