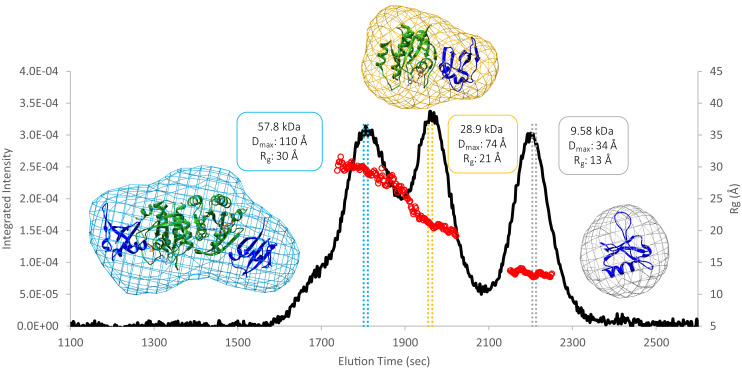
Fig. 1.
SEC-SAXS data collected for the three unique protein species that form in a solution containing the KRas-GppNHp G-domain and Raf-RBD. The black curve is the trace of the integrated X-ray scattering intensity (left axis), which correlates with protein concentration. The red data points correspond to the calculated radius of gyration (Rg, right axis) over elution time and indicate that the contents of each peak are monodisperse. The colored vertical bars through each peak indicate the data frames used to construct the corresponding molecular envelopes. Protein crystal structures were fit to the dimer (PDB ID 4G0N with dimer generated through a twofold crystallographic symmetry axis), monomer (PDB ID 4G0N asymmetric unity), and Raf-RBD (PDB ID 1RRB) envelopes using the volume fit function in Chimera.

