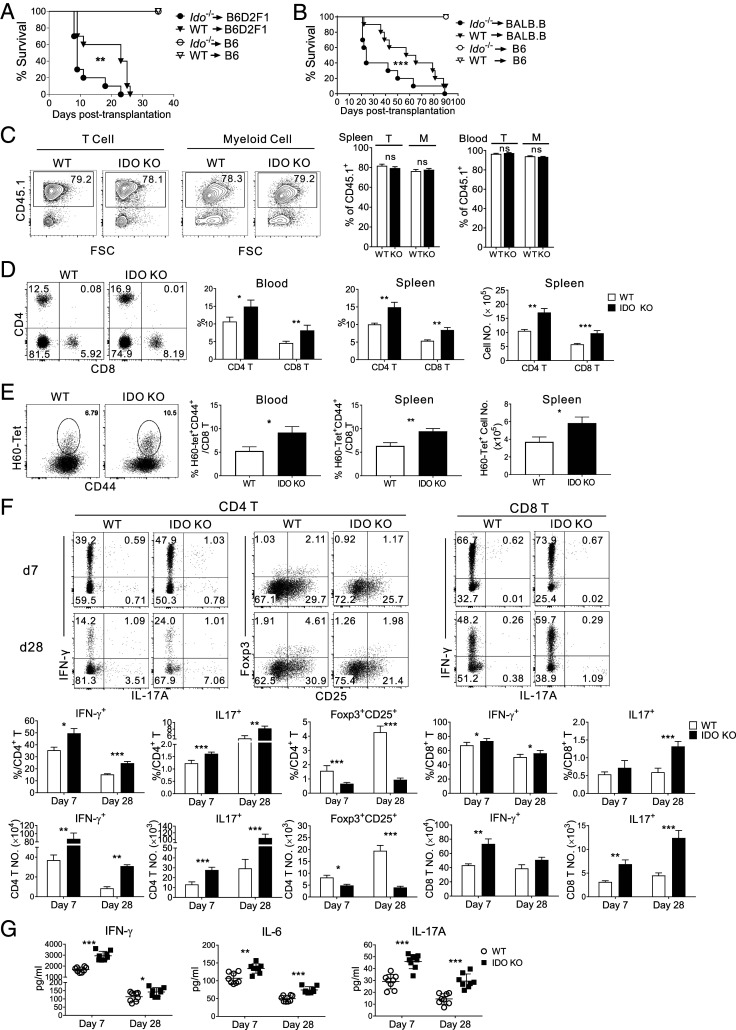
Fig. 1.
GVHD aggravation in IDO-KO BM recipients with systemic enhancement of proinflammatory T cell alloimmunity. (A and B) GVHD induction by transplantation of CD45.1+ IDO-KO or WT BM together with CD45.1+B6 WT T cells into (A) haploidentical recipient B6D2F1 or (B) MHC-matched but MiHA-mismatched BALB.B mice. Survival rates are also shown. Data are representative of two independent experiments (n = 6 to 10 per group per experiment). **P < 0.01, ***P < 0.001 as determined by log-rank (Mantel–Cox) test. (C–G) Analyses were performed using BALB.B hosts. (C) T and myeloid cell chimerism in the spleen and peripheral blood of IDO-KO-BM or WT-BM hosts on day 7 posttransplantation. Representative CD45.1/FSC profiles of T (CD3+) and myeloid cells (CD3-CD19−) in the spleens are shown. Proportions of CD45.1+ cells in T and myeloid (M) cells are plotted. (D and E) Flow cytometric analyses of (D) CD4+ and CD8+ T cells and (E) H60-tetramer-binding CD8+ T cells in the blood and spleen on day 7 posttransplantation. Representative flow cytometric data of splenocytes gated on CD45.1+ cells are shown. Percentages and numbers of total CD45.1+ CD4+ and CD8+ T cells, and H60-tetramer-binding CD8+ T cells are plotted. (F) Flow cytometric analysis of IFN-γ– and IL-17A–producing CD45.1+ CD4+ and CD8+ T cells, as well as of CD45.1+Foxp3+CD25+ Tregs in the spleens. Percentages and numbers of the corresponding cells are shown. (G) Serum IFN-γ, IL-6, and IL-17 levels. Representative data from at least three (C–G) independent experiments (C–F, n = 3 per group per experiment; G, n = 8 per group per experiment) are presented as means ± SEM (*P < 0.05, **P < 0.01, ***P < 0.001 as determined by Student’s t test). ns, not statistically significant.

