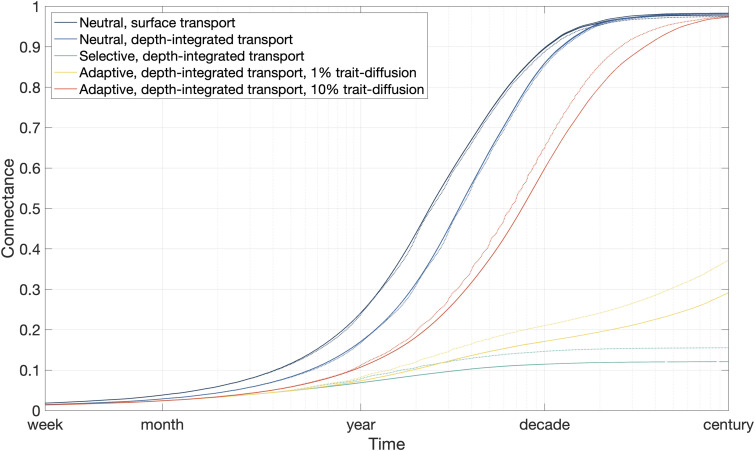
Fig. 2.
Fraction of connections between the 94 seed locations and the rest of the ocean through time. Solid lines show the results of simulations with time-invariant temperatures and carrying capacities. Dotted lines show the results of simulations with seasonally varying temperature and carrying capacity. Neutral simulations were repeated five times to 100 years. Selective and adaptive simulations were evaluated once to 100 years and four additional times to 10 years. (Please note that the replicate simulations are so alike that the lines are effectively plotted on top of each other.)

