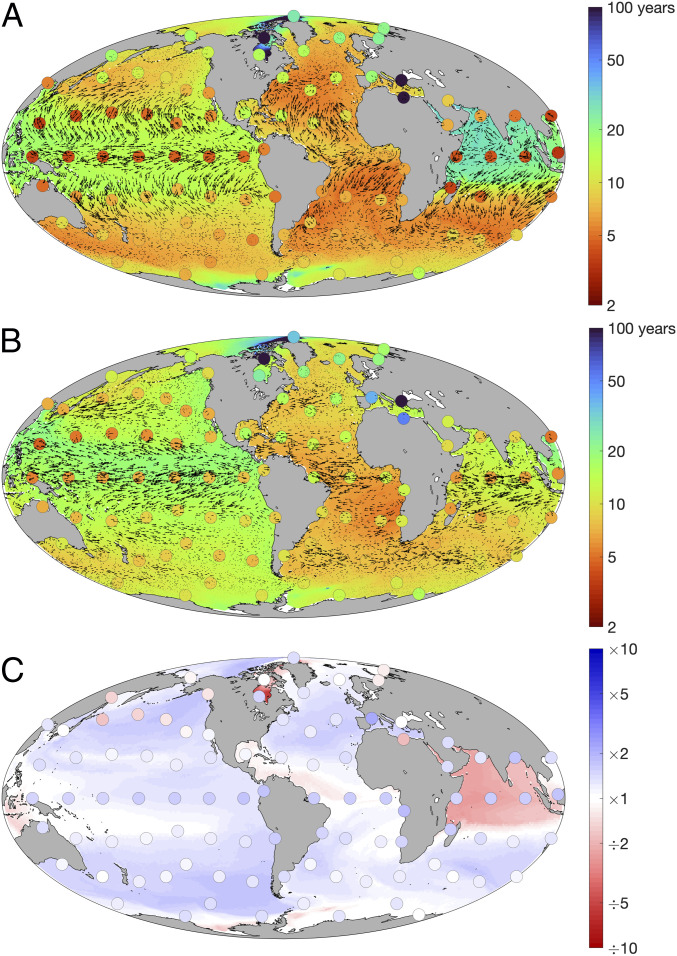
Fig. 3.
Immigration and emigration timescales (years) for ecologically neutral Prochlorococcus subpopulations, given (A) surface-only transport and (B) depth-integrated transport. Taxonomically distinct subpopulations were seeded in each of the 94 locations marked with dots. Emigration times, represented by the colored dots, are defined as the time taken for each seed subpopulation to disperse to 90% of all locations. Immigration times, represented by the background colors, are defined as the time taken for 90% of all seed subpopulations to arrive in each location. Planktonic transport velocities are shown as vectors. (C) Relative changes in global immigration and emigration times when switching from surface-only to depth-integrated transport (B A).

