Fig. 4.
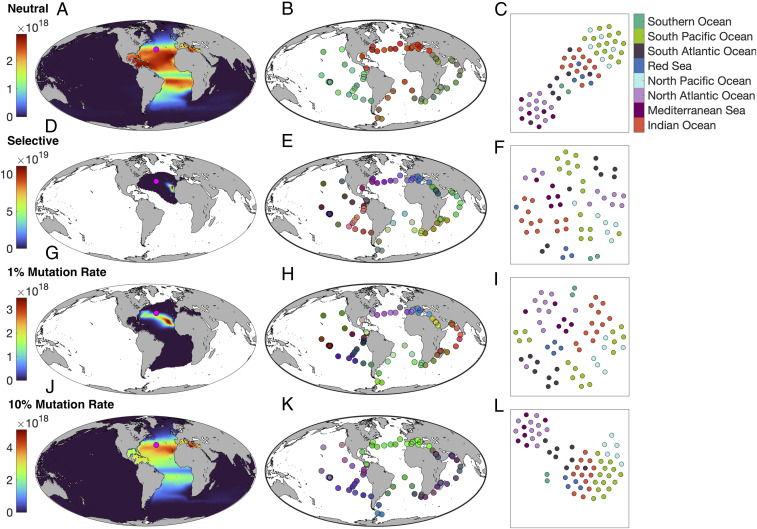
Global dispersal and taxonomic clustering of modeled subpopulations. Each row represents a different experiment. (A–C) Neutral case. (D–F) Selective case. (G–I) Adaptive case (1% mutation rate). (J–L) Adaptive case (10% mutation rate). A, D, G, and J map the global abundance distributions of individual seed populations, initialized at the site indicated by the pink dot (white areas indicate zero abundance). B, E, H, and K show community dissimilarity among the Tara Oceans sites, with similar sites assigned similar colors (cf. Fig. 1). C, F, I, and L show similar environmental clustering for the same Tara Oceans sites, with similar sites clustered together in the x and y coordinates. Colors indicate the ocean basin for each site. All panels show results after 100 years of dispersal.

