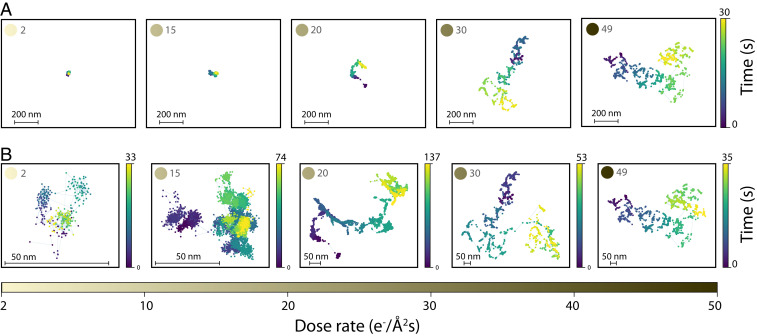
Fig. 1.
Representative trajectories of five gold nanorods as a function of dose rate varying between 2 and 49 e−/Å2s (A) in their first 30 s and scaled to the same size showing that the diffusivity increases upon increasing the dose rate; (B) diffusing for a longer time and magnified to show the change in the diffusive behavior upon increasing the dose rate.

