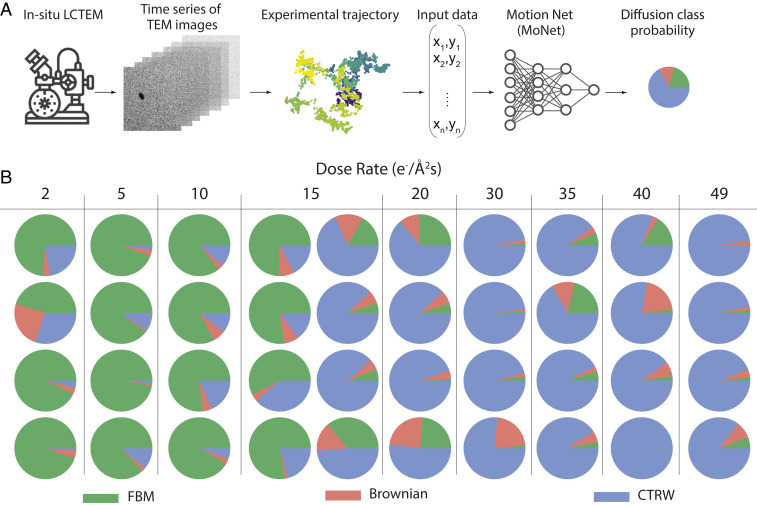
Fig. 2.
(A) Deep neural-network pipeline for anomalous diffusion classification on in situ LCTEM data using MoNet. (B) Neural-network analysis results for all trajectories studied as a function of dose rate (increasing from left to right across the table). Pie charts show the diffusion class probability where at low dose rates, there is a higher probability associated with an FBM (green) and at high dose rates there is a higher probability associated with a CTRW (blue).

