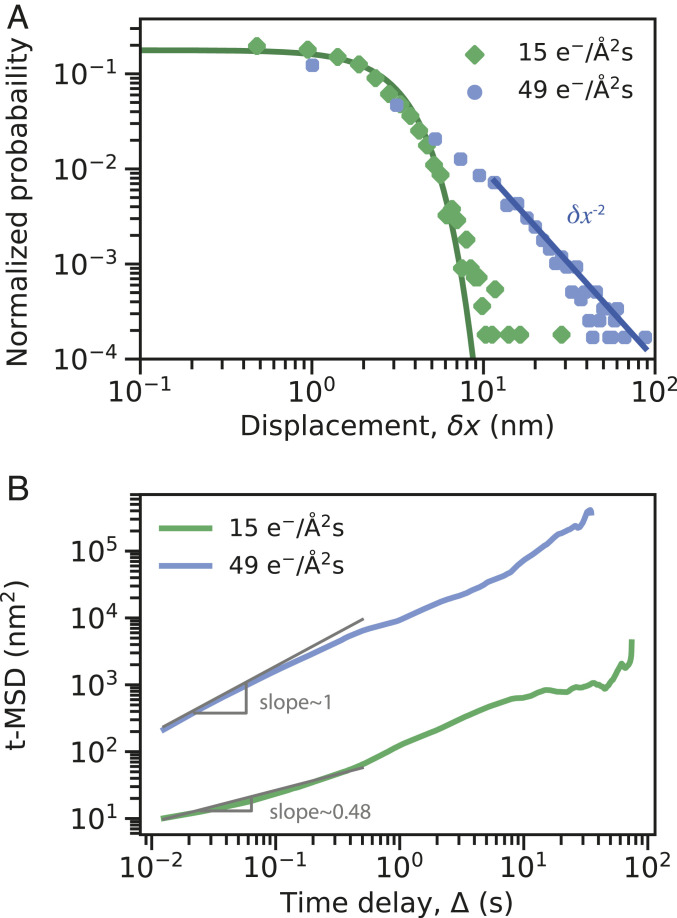
Fig. 4.
(A) Probability distribution of the absolute value of displacement for trajectories collected at the dose rates 15 and 49 e−/Å2s for time intervals of 0.0125 s, compared to a Gaussian fit (solid green line) and a power-law tail fit with power-law exponent of (solid blue line). (B) Time-averaged MSD vs. time delay calculated for the same trajectories of A. Solid gray lines show the fit to the MSD curves at short time delays with the slope of 0.48 for the low dose rate and slope of 1 for the high dose rate.

