Fig. 1.
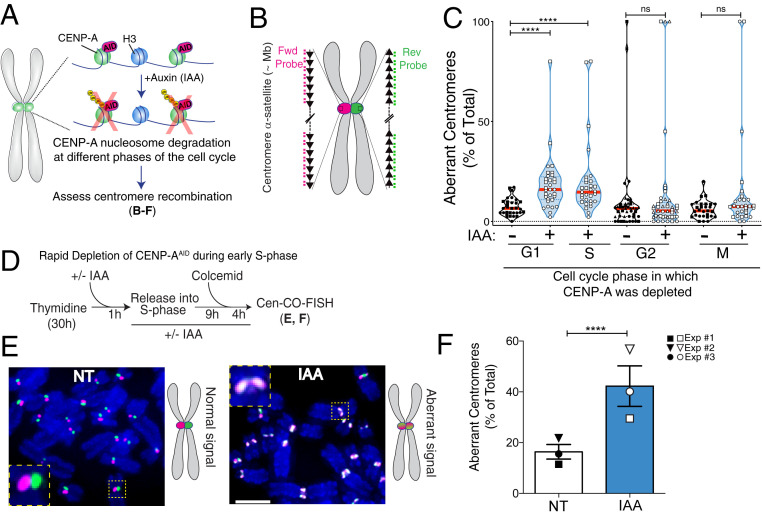
Rapid removal of CENP-A during S phase increases centromere recombination. (A) Schematic of the inducible degradation system to deplete endogenous CENP-A after addition of auxin (IAA) in RPE-1 cells. (B) Schematic illustration of the Cen-CO-FISH centromeric DNA probes. Hybridization by unidirectional peptide nucleic acid (PNA) probes differentially labels the forward or reverse strands of each sister chromatid. Each black arrow symbolizes a HOR in the alpha-satellite array. (C) Quantification of the percentage of aberrant Cen-CO-FISH patterns per cell with or without CENP-A depletion in the different phases of the cell cycle as indicated. For synchronization strategy, see SI Appendix, Fig. S1 H and I. Cells from two or three independent experiments are depicted with a different shape with n = 15 cells per condition and per experiment. Red lines represent the median. A Mann–Whitney U test was performed on the pooled single-cell data of two or three independent experiments: ****P < 0.0001; ns, not significant. (D) Synchronization strategy for the Cen-CO-FISH experiment shown in E and F. (E, Left) Representative Cen-CO-FISH on metaphase chromosomes after CENP-A depletion in the previous S phase. (E, Right) Schematic of the resulting Cen-CO-FISH staining patterns in normal and abnormal centromeres, with visible sister chromatid exchange (SCE) due to recombination and cross-over events. (Scale bar, 5 µm.) (F) Quantification of the percentage of aberrant Cen-CO-FISH patterns per cell in non-treated cells (NT) and after CENP-A depletion (IAA) in the previous S phase. The bar graph is the average of three independent experiments (depicted with different shapes) with n = 15 cells per condition. The bars represent the SEM. A Mann–Whitney U test was performed on pooled single-cell data of three independent experiments: ****P < 0.0001.

