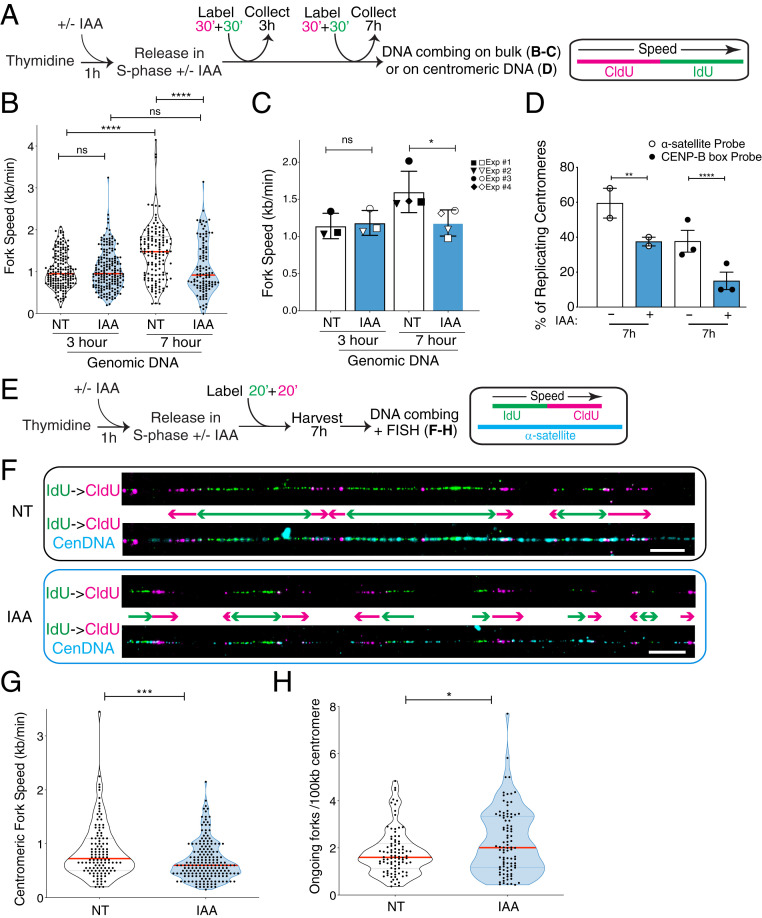
Fig. 2.
CENP-A removal leads to impaired replication fork progression through centromere alpha-satellites in late S phase. (A) Schematic illustration of the single-molecule DNA replication experiments shown in B–D. (B) Quantification of the replication fork speed in n > 100 tracks per condition. The red bars represent the median. Mann–Whitney U test: ****P < 0.0001. (C) Summary of the quantification of the replication fork speed in the bulk genome at 3 or 7 h after thymidine release in three or four independent experimental replicates represented by different symbols. The bars represent the SD of the mean. Mann–Whitney U test: *P = 0.0286. (D) Quantification of the percentage of actively replicating centromeres in the DNA combing assay (IdU- and/or CldU-positive). Two different oligo PNA probes were used to target alpha-satellites. Each dot represents one experiment with n > 30 centromeric tracks per condition. The bars represent the SEM. χ2 test: **P = 0.005, ****P < 0.0001. (E) Schematic illustration of the single-molecule DNA replication experiments at the centromeric regions shown in F–H, where six RNA probes were used to target alpha-satellites. (F) Representative images of single-molecule alpha-satellite DNA combing at 7 h after thymidine release. A probe mix recognizing alpha-satellite repeats was used to specifically label centromeres. (Scale bars, 10 µm.) (G) Quantification of the centromeric replication fork speed at 7 h after thymidine release. n > 110 tracks per condition. The lines represent the median with interquartile range. Mann–Whitney U test: ***P = 0.0006. (H) Quantification of the number of ongoing forks per 100 kb at centromeres at 7 h after thymidine release. n > 90 tracks per condition. The lines represent the median with interquartile range. Mann–Whitney U test: *P = 0.0411.

