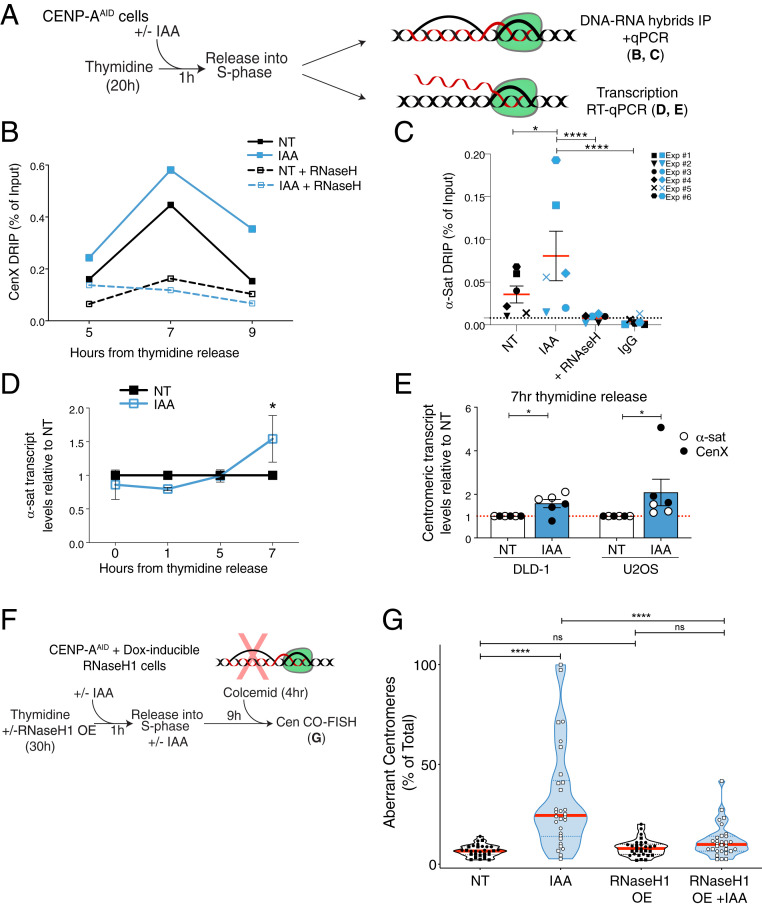
Fig. 3.
Accumulation of R loops following CENP-A depletion causes increased centromere recombination. (A) Schematic illustration of the experiments shown in B–E. (B) DRIP-qPCR quantification of the R-loop levels at the centromere of chromosome X as a measure of the percentage of input retrieved at different time points in S phase. n = 1. Each dot shows the mean of technical replicates. (C) DRIP-qPCR of R-loop levels at the centromeres as a measure of the percentage of input retrieved using alpha-satellite primers at 7 h after thymidine release. Each dot shows the mean of three technical replicates of six independent experiments represented by different symbols. A t test was performed including the technical replicates. *P = 0.019, ****P < 0.0001. (D) Quantification of centromere transcript levels using alpha-satellite primers by qRT-PCR after thymidine release. IAA data were normalized over the corresponding NT. Each dot represents the mean of two to eight independent experiments. The bars represent the SEM. One-sample Wilcoxon signed-rank test: *P = 0.0312. (E) Quantification of the transcript levels at the centromeres using alpha-satellite and Cen X primers and by qRT-PCR 7 h after thymidine release in DLD-1 and U2OS cells. IAA data were normalized over the corresponding NT. Each dot represents the mean of three technical replicates. The bars represent the SEM. U2OS cells: one-sample Wilcoxon signed-rank test: *P = 0.0312. DLD-1 cells: one-sample t test: *P = 0.0273. (F) Schematic illustration of the rescue experiment shown in G. (G) Quantification of the percentage of aberrant Cen-CO-FISH patterns per cell after RNase H1 overexpression (OE), and subsequent CENP-A depletion during the prior S phase. Cells from two independent experiments are depicted with a different shape with n = 15 cells per condition and per experiment. The red lines represent the median. A Mann–Whitney U test was performed on the pooled single-cell data of the two independent experiments: ****P < 0.0001.

