Fig. 4.
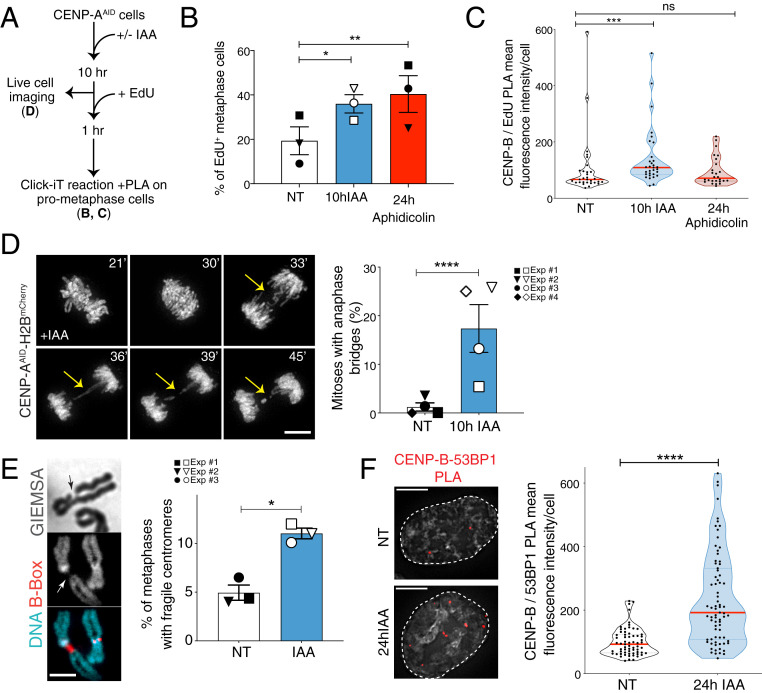
CENP-A removal in S phase causes centromere fragility in mitosis. (A) Schematic illustration of the experiments shown in B and C. (B) Quantification of the percentage of EdU-positive metaphases after 10 h IAA or 24 h aphidicolin (0.2 μM). Each dot represents one experiment. The bars represent the SEM. χ2 test: *P = 0.0435, **P = 0.0044. (C) Quantification of EdU-positive centromeres in metaphase cells by measuring mean fluorescence intensity signal from PLA between CENP-B and EdU-biotin after 10 h IAA or 24 h aphidicolin (0.2 μM). n > 25 cells per condition. The lines represent the median with interquartile range. Mann–Whitney U test: ***P = 0.0009. (D, Left) Representative still images of H2B-mCherry RPE-1 live-cell imaging showing the presence of an anaphase bridge (yellow arrows) after 10 h IAA. (Scale bar, 10 µm.) (D, Right) Quantification of the percentage of RPE-1 cells showing at least one anaphase bridge after 10 h IAA. Each dot represents one of four independent experiments depicted by different symbols. The bars represent the SEM. χ2 test: ****P < 0.0001. (E, Left) Representative FISH images of a chromosome with reduced DAPI/Giemsa staining at the centromere, identified with a CENP-B box FISH probe. (E, Right) Quantification of the percentage of metaphase spreads showing reduced DAPI/Giemsa staining at the centromere after 24 h IAA (square) or after thymidine release (circle and inverted triangle). Each dot represents one experiment with n > 70 cells. The bars represent the SEM. χ2 test: *P = 0.0113. (Scale bar, 3 µm.) (F, Left) Representative immunofluorescence images of PLA between CENP-B and 53BP1. (F, Right) Quantification of centromeric DNA damage in RPE-1 cells by measuring PLA mean fluorescence intensity signal between CENP-B and 53BP1 after 24 h IAA. n > 65 cells per condition. The bars represent the SEM. Mann–Whitney U test: ****P < 0.0001. (Scale bars, 5 µm.)

