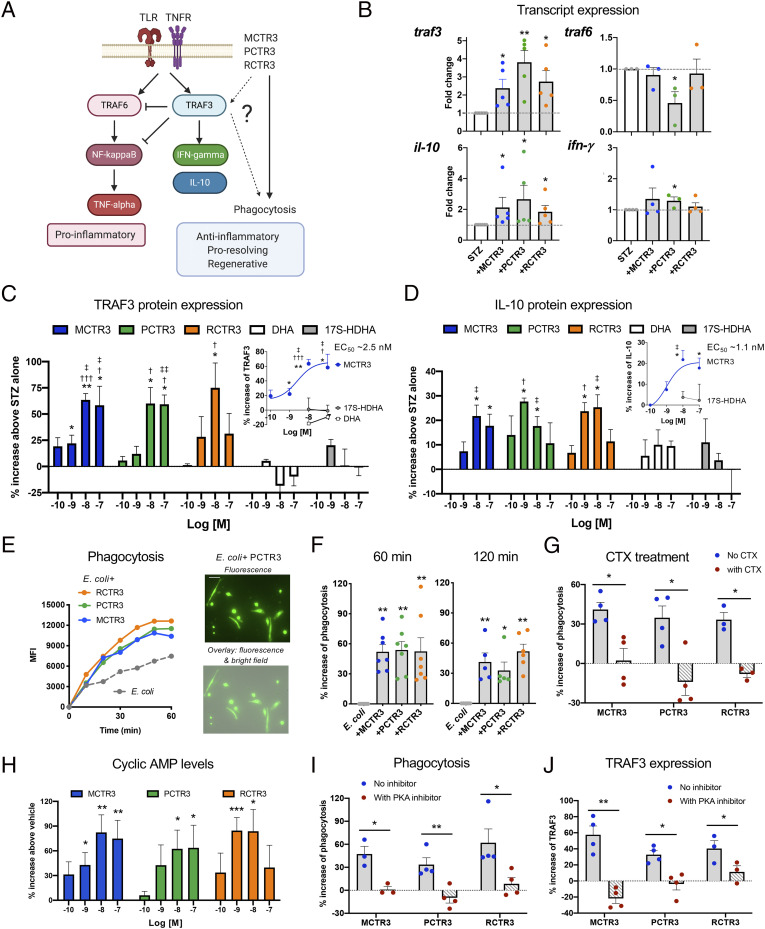
Fig. 3.
Cys-SPMs increase TRAF3 and phagocytosis with macrophages (A) Schematic representation of cys-SPMs and TRAF3 regulation of downstream effectors and phagocytosis. (B) Transcript expression. Human MΦ were incubated with STZ with each cys-SPM (10 nM) or vehicle for 6 h. Transcript levels were determined by qPCR and expressed as FCs of STZ alone; mean ± SEM, n = 5 (traf3 and il-10), 3 or 4 (traf6 and ifnγ); *P < 0.05, **P < 0.01 vs. STZ alone; two-tailed Student’s t test. (C and D) Dose–responses. Human MΦ were incubated with STZ with each cys-SPM (0.1 to 100 nM), DHA, 17S-HDHA (1 to 100 nM), or vehicle for 24 h. (C) Cells were lysed for TRAF3 ELISA and (D) supernatants collected for IL-10 ELISA. Results are percent increase compared with STZ; mean± SEM, n = 3 to 5; *P < 0.05, **P < 0.01, vs. STZ alone; one-way ANOVA; †P < 0.05, †††P < 0.001 vs. DHA; ‡P < 0.05, ‡‡P < 0.01 vs. 17S-HDHA at the same concentrations; two-tailed Student’s t test. (C and D, Insets) Dose–response curves of MCTR3 with DHA and/or 17S-HDHA. EC50s were estimated using nonlinear regression with log (agonist) vs. response (three parameters). (E–G and I) Phagocytosis. Human MΦ were plated onto slide chambers (1 × 10⁵ cells per well) and incubated with each cys-SPM (10 nM) or vehicle control for 24 h, followed by addition of BacLight green-labeled E. coli (5 × 10⁶ CFU) to initiate phagocytosis. Fluorescent images were then recorded every 10 min for 120 min. In each experiment, four fields (20×) per condition (per well) were recorded. (E, Left) mean fluorescence intensity (MFI)/cell, average of 124 cells per field and 4 fields per condition from one representative experiment. (Right) Representative images. (Scale bar, 50 μm.) (F) Percent increase of phagocytosis compared with E. coli alone; mean± SEM, n = 5 to 7; *P < 0.05, **P < 0.01. (G and I) Cholera toxin (CTX; 1 μg/mL), PKA inhibitor (H89, 10 μM), or vehicle were incubated with MΦ together with cys-SPMs. Results are percent increase of phagocytosis compared with E. coli alone at 60 min; mean ± SEM, n = 3 or 4; *P < 0.05, **P < 0.01; (F) one-way ANOVA; (G and I) two-tailed Student’s t test. (H) cAMP. Human MΦ were incubated with each cys-SPM (0.1 to 100 nM) for 15 min. Cells were lysed and cAMP levels determined. Results are percent increase above vehicle; mean ± SEM, n = 5; *P < 0.05, **P < 0.01, ***P < 0.001 vs. vehicle; one-way ANOVA. (J) TRAF3 expression was determined as in C in the absence or presence of a PKA inhibitor. Results are percent increase of STZ alone; mean ± SEM, n = 3 or 4; *P < 0.05, **P < 0.01; two-tailed Student’s t test.

