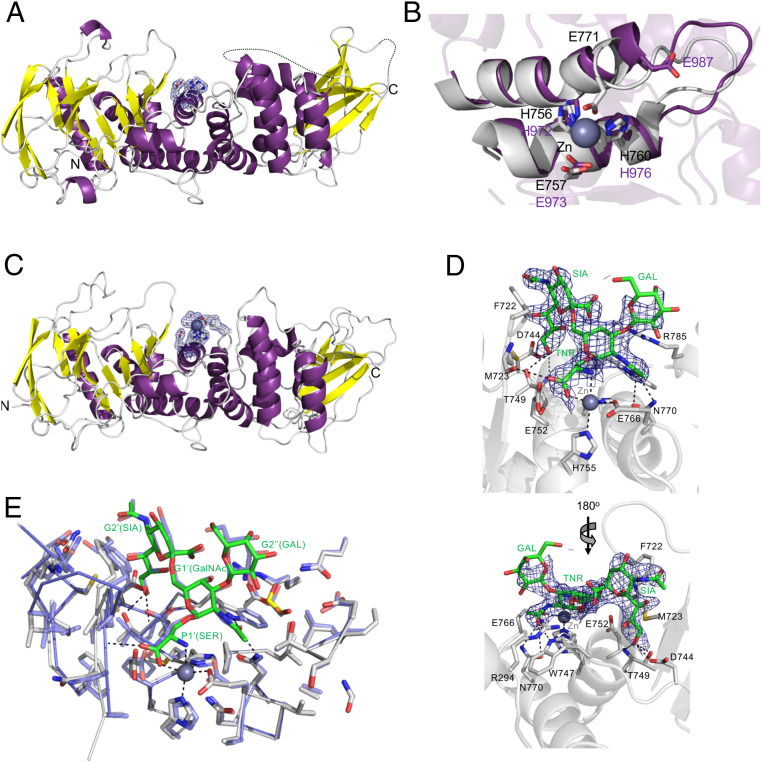
Fig. 2.
Structure analysis of the ZmpA and ZmpC M60 domains. (A) A cartoon representation of ZmpA_m with the putative catalytic center surrounded by a σa-weighted Fo-Fc omit map contoured at 3σ. (B) Overlay of the catalytic center of ZmpB (gray with bound the zinc ion as a sphere) with the putative catalytic center of ZmpA_m (purple). (C) A cartoon representation of ZmpC_m with the putative catalytic center surrounded by a σa-weighted Fo-Fc omit map contoured at 3σ. A bound zinc ion with its coordinating waters are shown as gray and red spheres, respectively. (D) The complex of ZmpC_m with Galβ1–3[Neu5Acα2–6]GalNAcα1-Ser shown from two angles. The blue mesh shows the electron density of the glycosylated amino acid (shown as green sticks) as a σa-weighted Fo-Fc omit map contoured at 3σ. Relevant amino acids in the active site that interact with the ligand are shown as sticks and hydrogen bonds as dashed lines. The catalytic glutamic acid residue is E752. The bound zinc ion is shown as a gray sphere. (E) Comparison of the ZmpB and ZmpC O-glycopeptidase catalytic sites. The structure of ZmpB_m in complex with Galβ1–3(Neu5Acα2–6)GalNAcα1-Ser (blue; PDB ID 1KDU) overlapped with the structure of ZmpC_m in complex with Galβ1–3(Neu5Acα2–6)GalNAcα1-Ser (gray and the ligand in green sticks). Individual residues in the ligands and the G subsites they occupy are labeled. All residues in the vicinity of the ligand are shown as sticks, revealing very high sequence and structure identity in the active sites.

