Fig. 1.
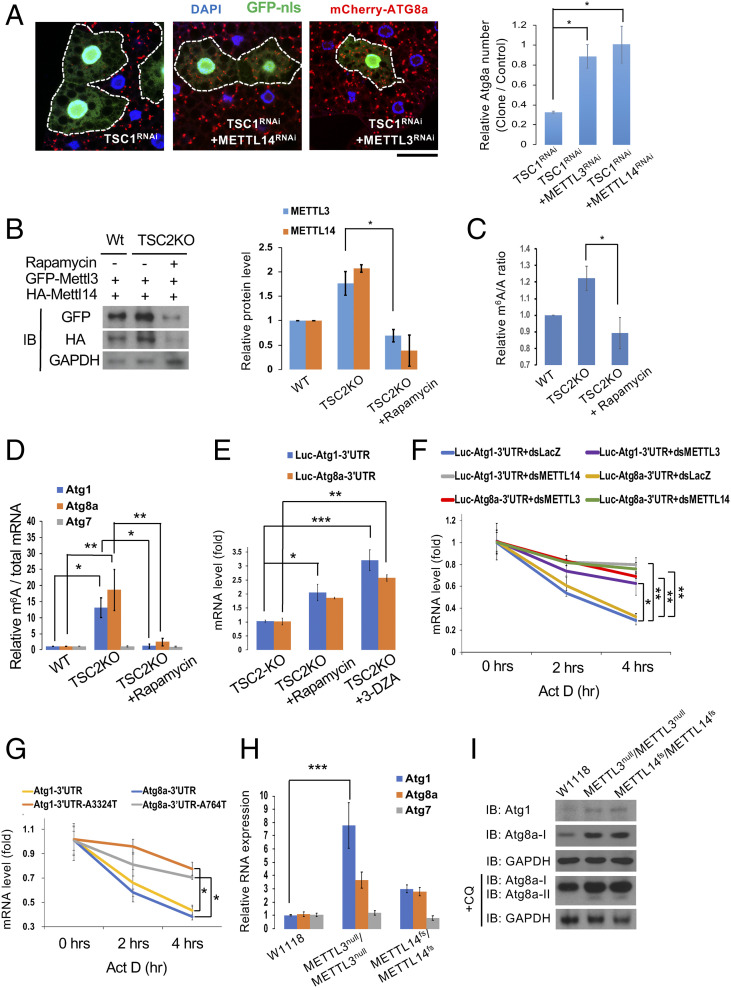
mTORC1 signaling regulates the MTC to suppress autophagy. (A) MTC acts downstream of mTORC1 signaling. Clonal depletion of TSC1 in GFP-labeled cells suppressed the formation of mCherry-ATG8a puncta under starvation conditions (compared to control cells outside the circled dashed lines). Coexpression of METTL3RNAi or METTL14RNAi reversed the TSC1RNAi-induced effect. Fat body cells were stained with DAPI. (Scale bar, 20 µm.) Quantification of the relative number of mCherry-ATG8a dots per cell. (B) mTORC1 activity regulates METTL3 and METTL14 protein levels. Wild-type S2R+ or TSC2 KO cells transfected with GFP-METTL3 or HA-METTL14 were treated with or without rapamycin. The protein levels of METTL3, METTL14, and GAPDH were analyzed by immunoblotting (IB) with antibodies as indicated and quantified. (C and D) mTORC1 signaling modulates global m6A RNA methylation levels as well as m6A levels in Atg transcripts. m6A levels were quantified using LC-MS in S2R+ cells treated as indicated. Compared with wild-type S2R+ cells, TSC2 KO cells showed enhanced m6A levels in their mRNAs while rapamycin treatment on TSC2 KO cells reduced it (C). Abundance of Atg1, Atg8a, and Atg7 transcripts among mRNA immunoprecipitated with anti-m6A antibody from S2R+ cells treated as indicated. m6A-modified Atg1 and Atg8a, but not Atg7 mRNAs, were increased in TSC2 KO cells, and rapamycin treatment in TSC2 KO cells can reduce it (D). (E) mTORC1 and MTC activities decrease Atg1 and Atg8a mRNA levels through their 3′ UTR regions. Firefly luciferase reporters with Atg1 or Atg8a 3′ UTRs were transfected into S2R+ cells. After 48 h, cells were treated with rapamycin (20 nM) or 3-DZA (100 μM) for 48 h and mRNA levels of Firefly luciferase were measured by qPCR. (F and G) m6A methylation is required for Atg1 and Atg8a mRNA degradation. Firefly luciferase reporters with the indicated 3′ UTRs were transfected into S2R+ cells treated with or without dsRNA against LacZ, METTL3, or METTL14. After 48 h, cells were treated with actinomycin D (10 μg/mL) for the indicated times to measure mRNA levels of Firefly luciferase by qPCR. (H and I) METTL3 and METTL14 mutants exhibit higher Atg1 and Atg8a transcripts as well as ATG1 and ATG8a protein levels in the larval fat body. RNA (H) or protein (I) extracts from larval fat bodies of wild-type (w1118), METTL3 null mutant (METTL3null/METTL3null), or METTL14 mutant (METTL14fs/METTL14fs), fed with or without CQ, were subjected to qPCR assay (H) or Western blot analysis using antibodies as indicated (I). One-way ANOVA test was performed followed by Tukey’s test to identify significant differences. Measurements shown are mean ± SEM of triplicates; *P < 0.05; **P < 0.01; ***P < 0.001.

