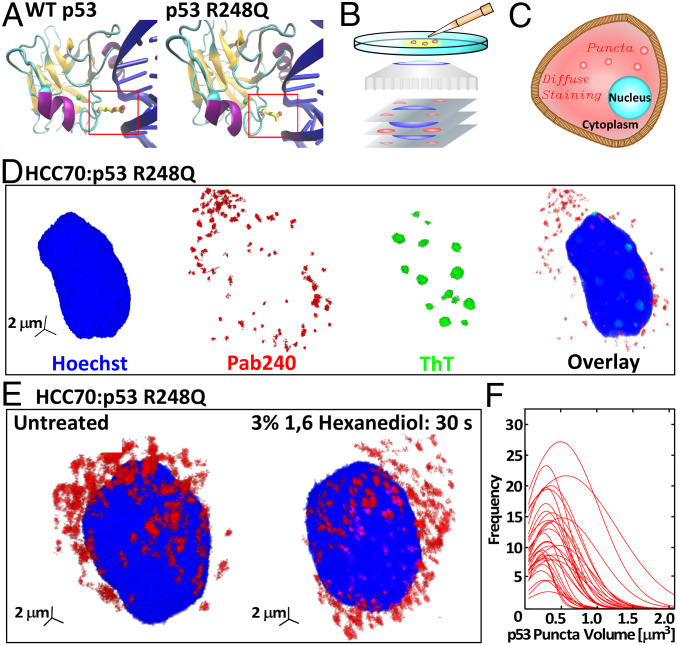
Fig. 1.
The R248Q mutation and aggregation on p53 R248Q in breast cancer cells. (A) The structure of the DBD (94 to 292) of wild-type p53 and the R248Q (Arg-248 Gln) mutant. Nitrogen atoms are colored in red, zinc in green, alpha helices in purple, beta sheets in orange, and DNA in blue. Protein Data Bank ID is 1TUP (23) for wild-type p53; prediction of p53 R248Q DNA interaction was done using Visual Molecular Dynamics (24). (B) Schematic of confocal immunofluorescence microscopy in which antibodies that specifically target cell components of interest are tagged with fluorescent dyes. The spatial distribution of the fluorescent signal collected by the microscope maps the 3D distribution of the target molecule. (C) Illustration of diffuse and punctate staining in the cytoplasm. (D) Combined staining of HCC70 cells with a Hoechst dye, which stains the nucleus, Pab240, which binds to unfolded or aggregated p53, and ThT, which recognizes amyloid structures. (E) Staining of HCC70 cells with Pab240 before and after treatment with 1,6-hexanediol, known to disperse dense liquid droplets of disordered proteins. (F) Distributions of the volumes of the puncta found in HCC70 cells treated with Pab240. Each trace represents the volume distribution of puncta from a single cell.

