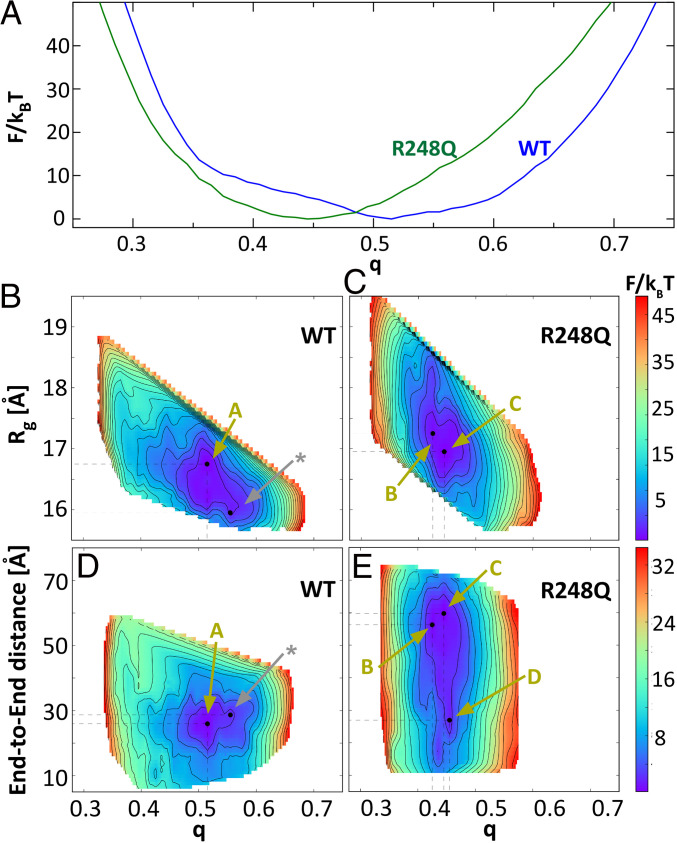
Fig. 4.
The free energy F of the conformations of wild type and p53 R248Q DBD. (A) As a function of the reaction coordinate q, which measures the similarity of the DBD conformation to a structure determined by X-ray crystallography (23). (B–E) 2D profiles of F as function of q and radius of gyration, Rg, in B and C, and end-to-end distance, D, in D and E, of the DBD chain. Gold arrows labeled with letters A through C point to the states of the structures in the respective panels in Fig. 5. The silver arrow labeled with a star indicates the state of the reference structure depicted with silver ribbons in Fig. 5 A–D.

