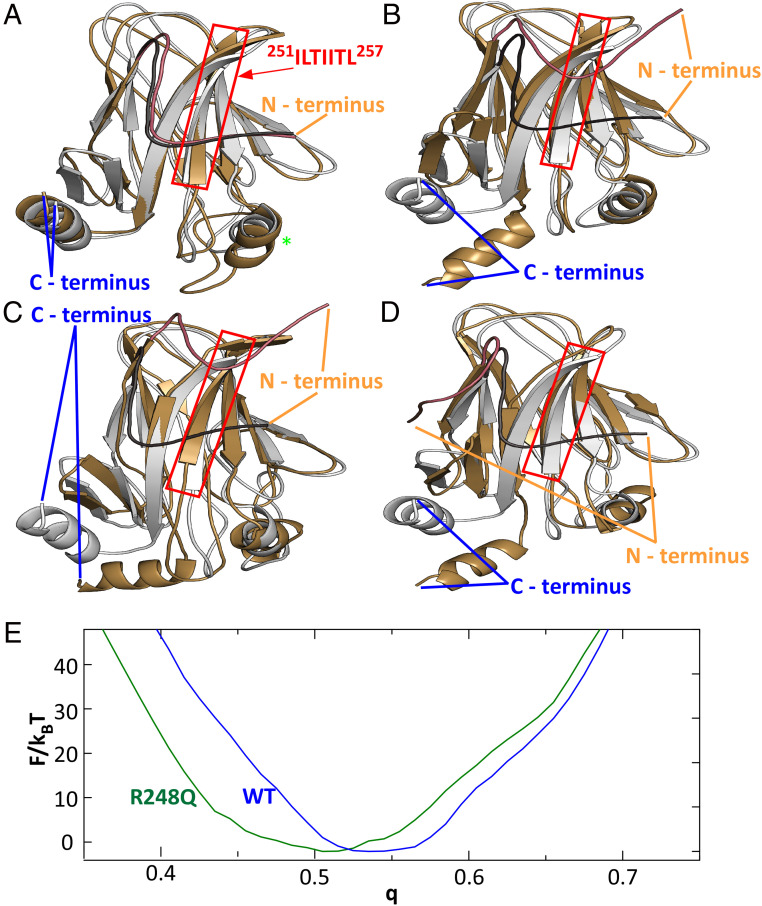
Fig. 5.
Conformational changes induced by the R248Q mutation. (A) Comparison of wild-type DBD structures corresponding to F(q) minima at q = 0.555 (silver) and q = 0.515 (gold). Red box highlights the aggregation prone sequence, protected by the N terminus tail in wild-type p53 and exposed in p53 R248Q. Green star indicates residues 168 to 193, the location of the strongest deviation of between the two modeled wild-type conformations. (B–D) Comparisons of wild-type DBD structures corresponding to the F(q) minimum at q = 0.555 (silver) to the DBD structures of p53 R248Q (gold) at F(q) minima at q = 0.425 in B; at q = 0.445 in C; and at q = 0.455 in D. In A–D, the N terminus tail of the reference structure is highlighted in charcoal and that of the second structure in copper. (E) Free energy profiles F(q) for the cores of the DBDs (residues 107 to 276) of wild type and p53 R248Q.

