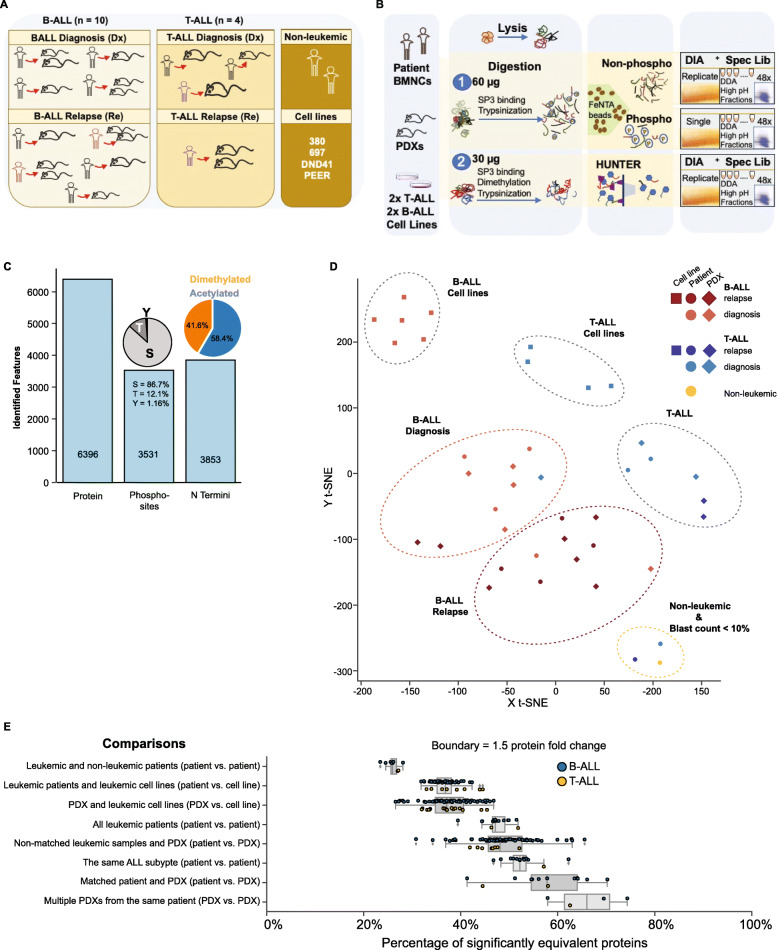
Fig. 1.
Proteomics stratifies pediatric ALL subtypes. a Composition of samples including number of childhood leukemia subtypes and disease stages, non-leukemic group, and leukemic cell lines analyzed. Same colours are maintained for ALL patient samples collected at different disease stages. Due to sample availability, our study did not include matched diagnosis and relapse samples from leukemic patients. b Detailed workflow for investigation of total protein, N Terminome, and phosphoproteome of pediatric ALL from minimal protein starting amount (60 μg protein for total and phosphoproteome study, 30 μg for N termini study). Proteome features were measured using Data Independent Acquisition (DIA) mass spectrometry methods, and analyzed with spectral libraries generated using combined information from DIA analysis and Data Dependent Analysis (DDA) of high pH fractionated sample pools. c Summary of quantified proteins (6396), phosphosites (3531), and N termini (3853) respectively. d T-distributed Stochastic Neighbor Embedding, t-SNE, plot following unsupervised analyses on average protein intensities (N = 5554) and K-means clustering on reduced dimensions from t-SNE. Clusters depict protein-level similarities and differences between model organisms (13 patients, 19 PDXs, 4 cell lines), disease subtypes (8 B-ALL, 3 T-cell leukemia), and disease stages (7 diagnosis, 6 relapse). e Each box plot shows the percentage of proteins with equivalent protein abundance (fold change < 1.5) for each combination of sample pairs compared within a sample group (See Methods for details of TOSTone test). The box plots show the percentage number of equivalent proteins from TOSTone tests performed between each ALL patient and the non-leukemic samples, leukemic patients and pediatric ALL cell lines, PDXs and pediatric ALL cell lines, all leukemic patients irrespective of disease subtype, non-matched patients and PDXs, patients with the same ALL subtype, matched patient and PDX pairs, and between multiple PDXs generated from a similar patient material. Box whiskers indicate standard deviation from the mean, and the mean equivalence is shown for each box plot. B-ALL and T-ALL samples for each comparison are represented with blue and yellow circles respectively

