Fig. 5.
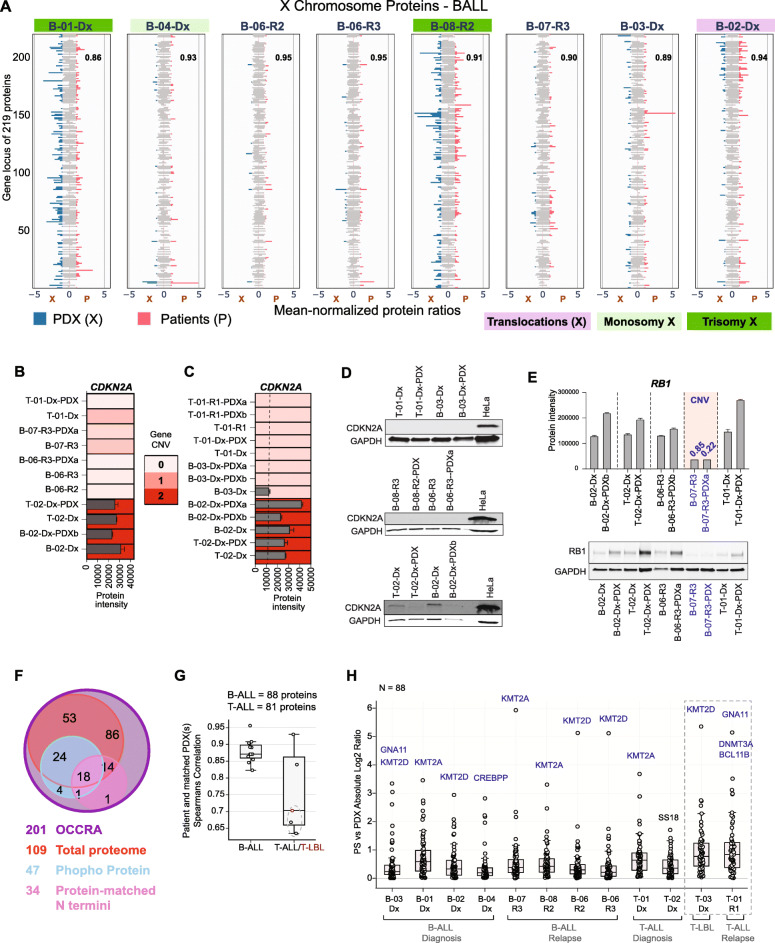
Pediatric ALL proteome reflects consequences of genomic changes. a Mean-normalized protein intensities of 219 quantified protein products from genes on chromosome X in 8 patients (P, pink bars) and in their matched PDXs (X, blue bars). Average intensities are reported for multiple PDXs engrafted with the same patient leukemia. Patients with structural defects in their X chromosome are highlighted – translocation in purple, monosomy X in light green, and trisomy X in dark green. Pearson correlation coefficient score for each matched patient and PDX pair is provided inset. b CDKN2A copy number determined by targeted gene sequencing in matched patient and PDXs, and CDKN2A protein level in same patient and xenograft samples. c CDKN2A protein level in all samples with one or two copies of CDKN2A, as confirmed by clinical cytogenetics and/or targeted gene sequencing. d Immunoblot analysis of primary and PDX samples with no copy of CDKN2A (B-06); one copy of CDKN2A (T01 and B-03), and two copies of CDKN2A respectively. A HeLa positive control is included in each panel. Due to limited availability, different sample amounts were loaded on the same gel and is apparent in the lower GAPDH control levels for two PDX samples. e RB1 copy number variation determined by targeted gene sequencing, and RB1 protein level measured by mass spectrometry and immunoblot in same paired patient and xenograft samples. b, c, e Bar plots are mean protein abundance from two DIA technical replicates, and error bars represent the standard deviation from the mean. CNV = copy number variation, and is highlighted in blue. f Summary of 201 OCCRA panel genes profiled in total protein (109), phosphoprotein (47), and matched protein N termini (34) data from clinical samples. g Spearman correlation scores for quantified OCCRA proteins in paired patient and PDX leukemia samples (B-ALL = 88 proteins, T-ALL = 81 proteins). Points highlighted with dashed semi-circles represent values from comparing protein abundance in patients with low blast count (< 10%) and their matched PDXs: T-01-R1 and T-01-R1-PDXa, T-01-R1 and T-01-R1-PDXb, T-03-Dx and T-03-Dx-PDX respectively. h Absolute Log2 ratios of protein intensities (N = 88) in 12 ALL patients and their corresponding PDX. Proteins with highest variation between both models are highlighted in blue. Values form patients with reduced bone marrow involvement (< 10% blasts) and their corresponding PDXs are highlighted in dashed border lines

