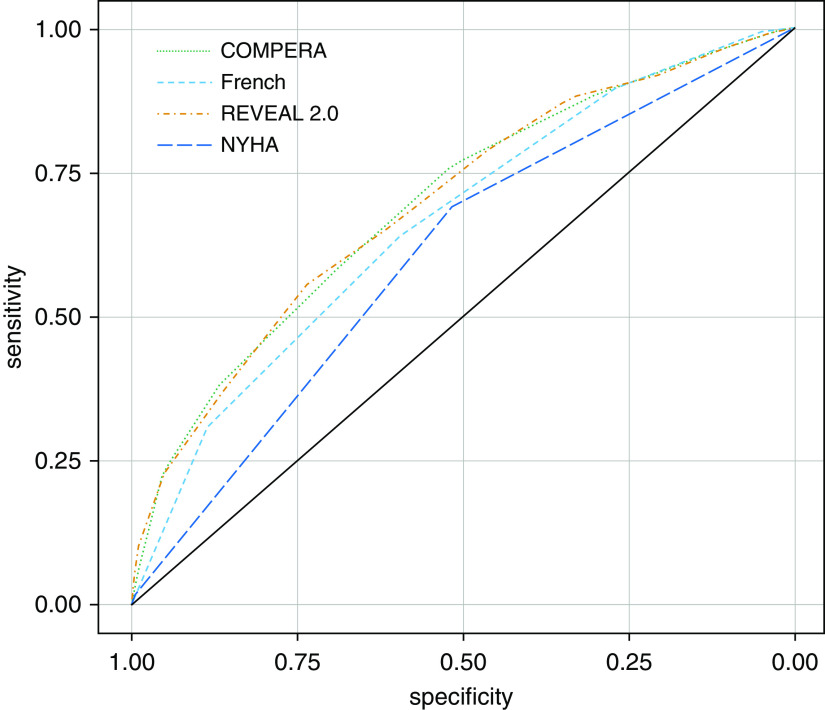
Figure 1.
Receiver operating curves (ROCs) for each investigational algorithm. The population used for ROCs included pooled placebo patients from each clinical trial with all available values listed in Table 2, excluding variables not available for any trial. N = 793. Area under curve (AUC) comparable for all risk algorithms for prediction of clinical worsening at end of study (COMPERA AUC, 0.70; 95% confidence interval [CI], 0.66–0.73; French score AUC, 0.66 95% CI, 0.63–0.70; and REVEAL 2.0 AUC, 0.70; 95% CI, 0.66–0.73. All investigational algorithms outperformed NYHA Classification (AUC, 0.61; 95% CI, 0.57–0.64) in nonparametric statistical analysis (COMPERA P = 2.26 × 10⁻⁶; French P = 6.5 × 10⁻⁴; and REVEAL P = 1.63 × 10⁻⁶). COMPERA = Comparative, Prospective Registry of Newly Initiated Therapies for Pulmonary Hypertension; French = French score; NYHA = New York Heart Association; REVEAL = Registry to Evaluate Early and Long-Term Pulmonary Arterial Hypertension Disease Management.

