Figure 1.

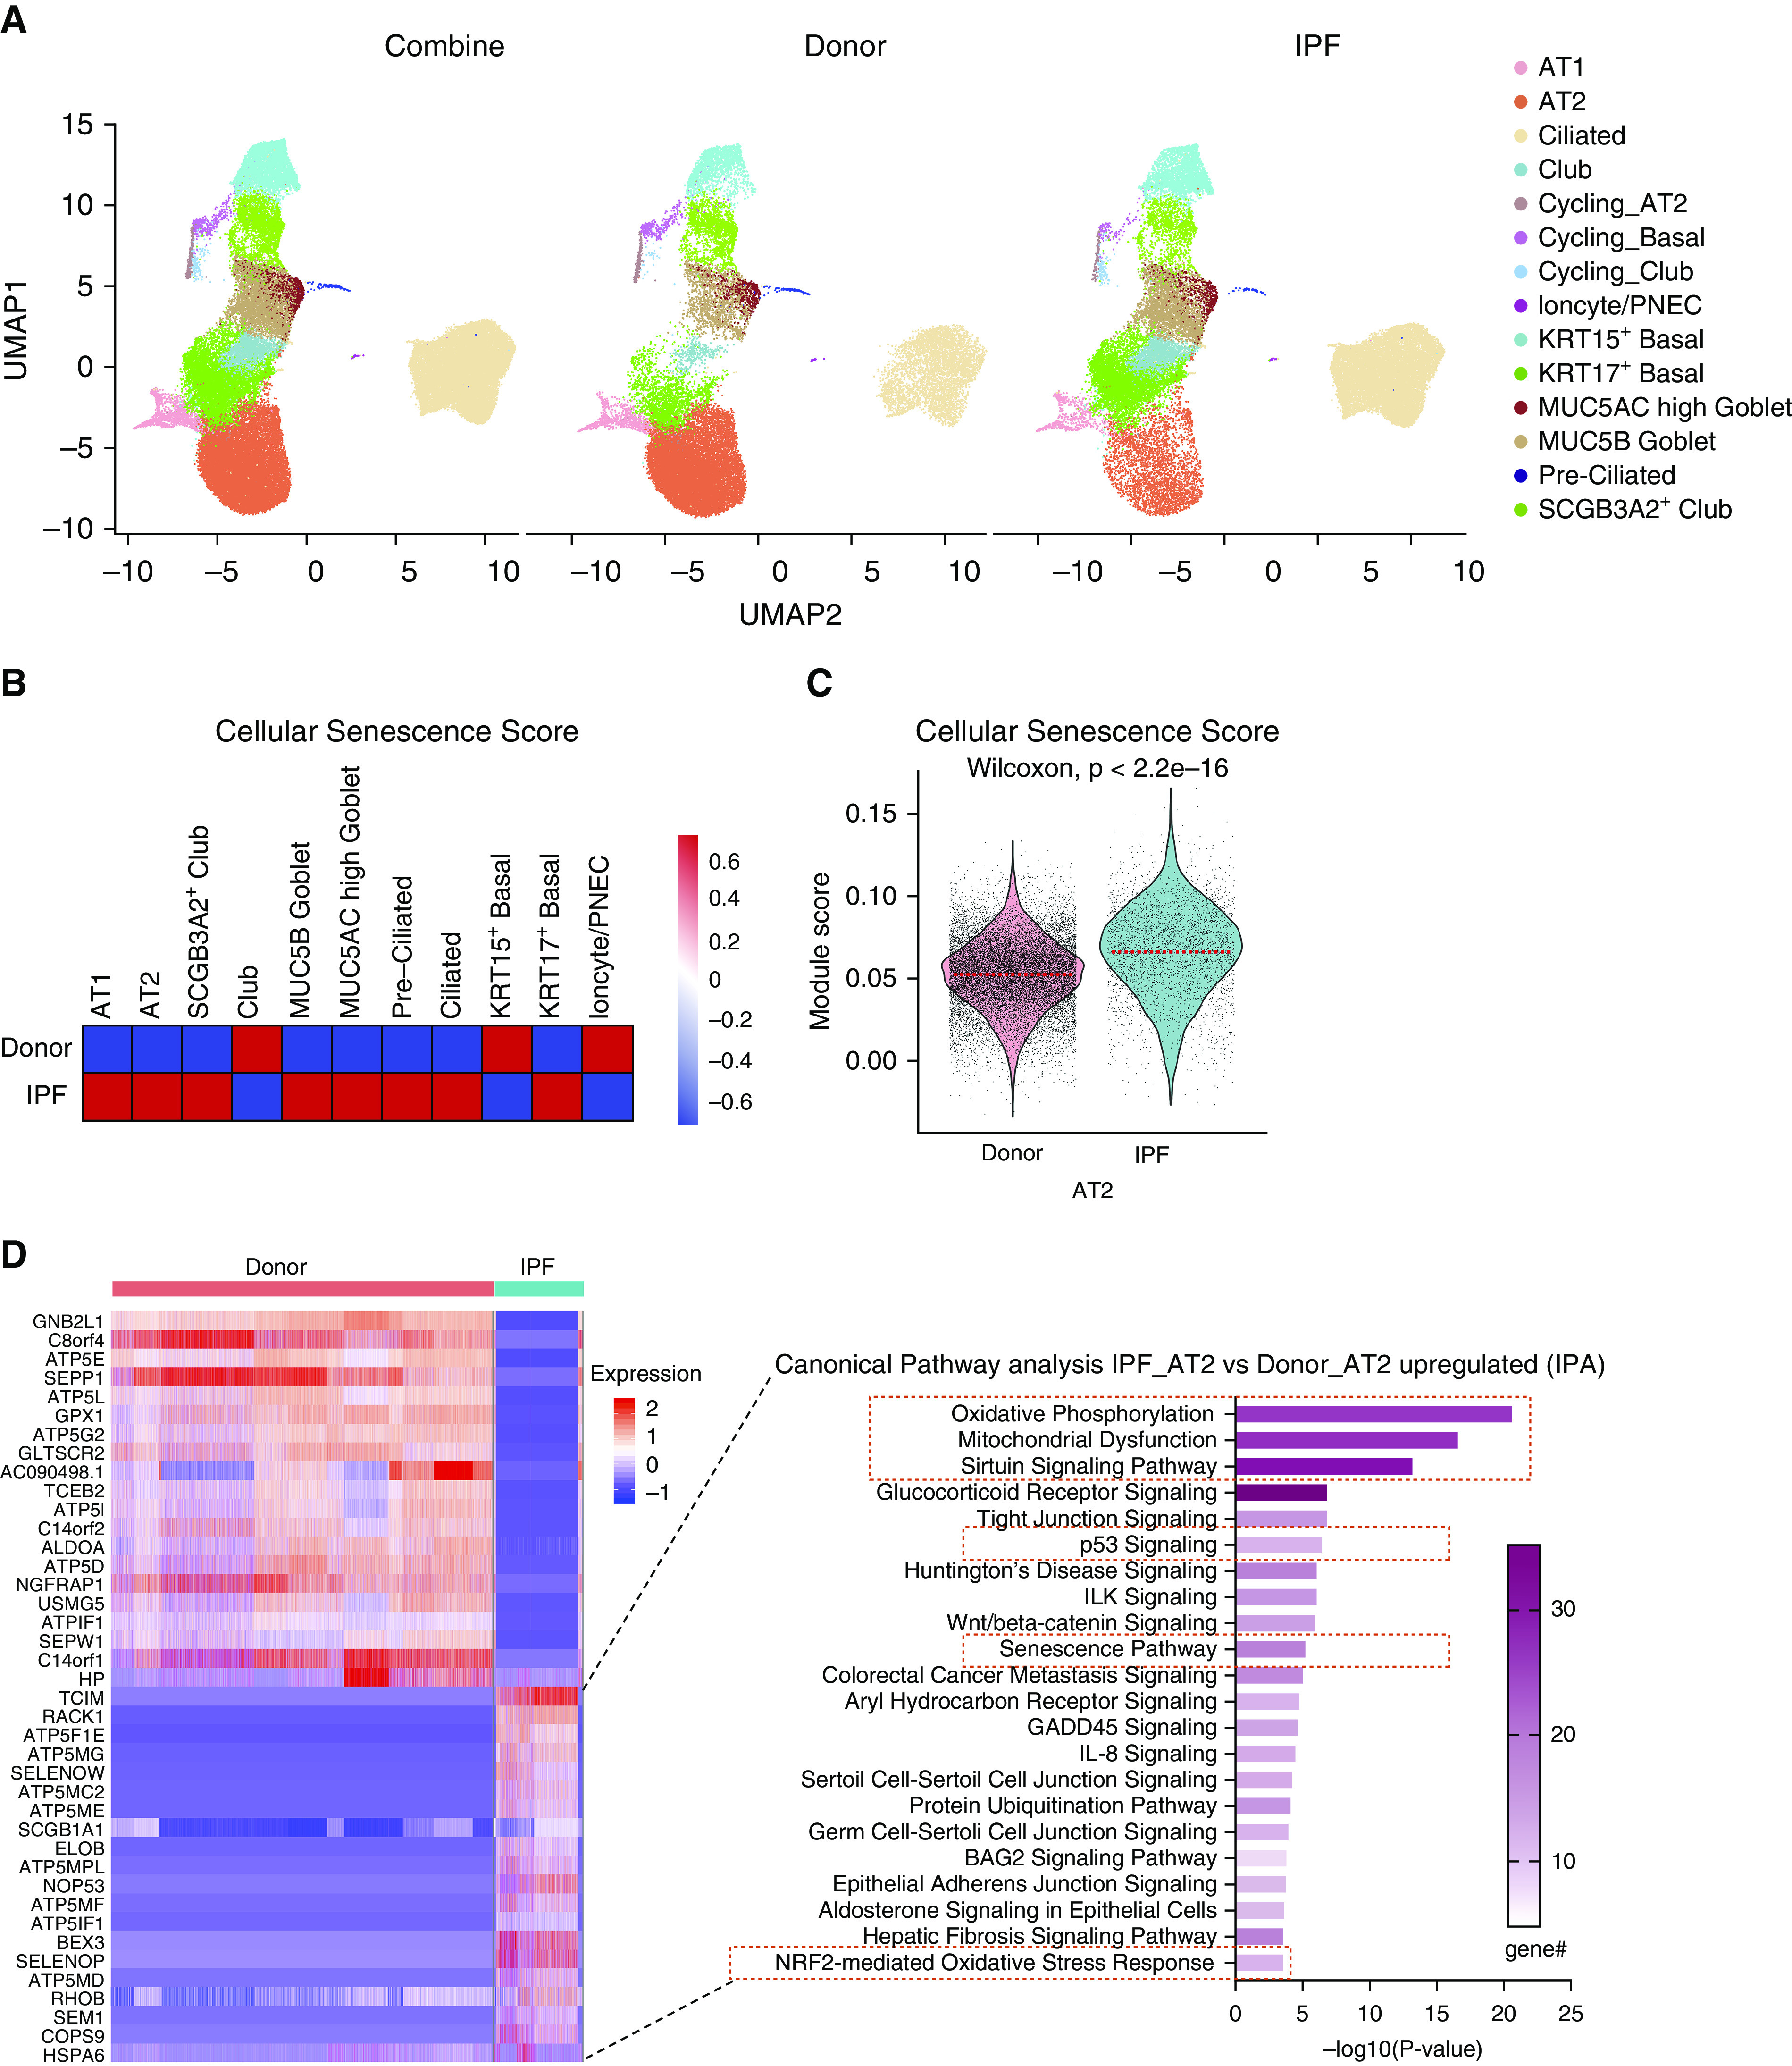
Accumulation of senescent alveolar type 2 (AT2) cells in idiopathic pulmonary fibrosis (IPF) explant tissue. (A) Uniform manifold approximation and projection (UMAP) visualization of cell type clustering (AT1, AT2, club [SCGB3A2+, SCGB1A1+], SCGB3A2+ club-like [SCGB3A2+, SCGB1A1−], ciliated, preciliated [MCIDAS+], MUC5AC high goblet [MUC5AC+, MUC5B+], MUC5B high goblet [MUC5AC−, MUC5B+], KRT15+ basal [KRT5 high, KRT17+, KRT15 high], KRT17+ basal [KRT5 low, KRT17+, KRT15 low], and ionocyte) and cell origin of single-cell RNA sequencing data on isolated epithelial cells from donor lung tissues and fibrotic region of lung tissue from patients with IPF (9 donor patient samples and 11 IPF patient samples). (B) Heat-map visualization of cellular senescence score based on core senescence genes of all epithelial cell types. Color scale represents log-transformed ratio of cellular senescence score. (C) Violin plot visualization of cellular senescence score based on core senescence genes of the AT2 cell subset from human epithelial cell single-cell RNA sequencing. The dashed line indicates the median value of each group. (D) Heat map of the top 20 differential expression genes of the AT2 cell subset comparing IPF with donor and top canonical pathways of genes upregulated in IPF AT2 cells identified by Ingenuity Pathway Analysis; senescence pathway and senescence-related pathways are highlighted. In total, 506 significantly upregulated genes and 1,209 significantly downregulated genes comparing IPF AT2 cells with donor AT2 cells. IPA = Ingenuity Pathway Analysis; PNEC = pulmonary neuroendocrine cell.
