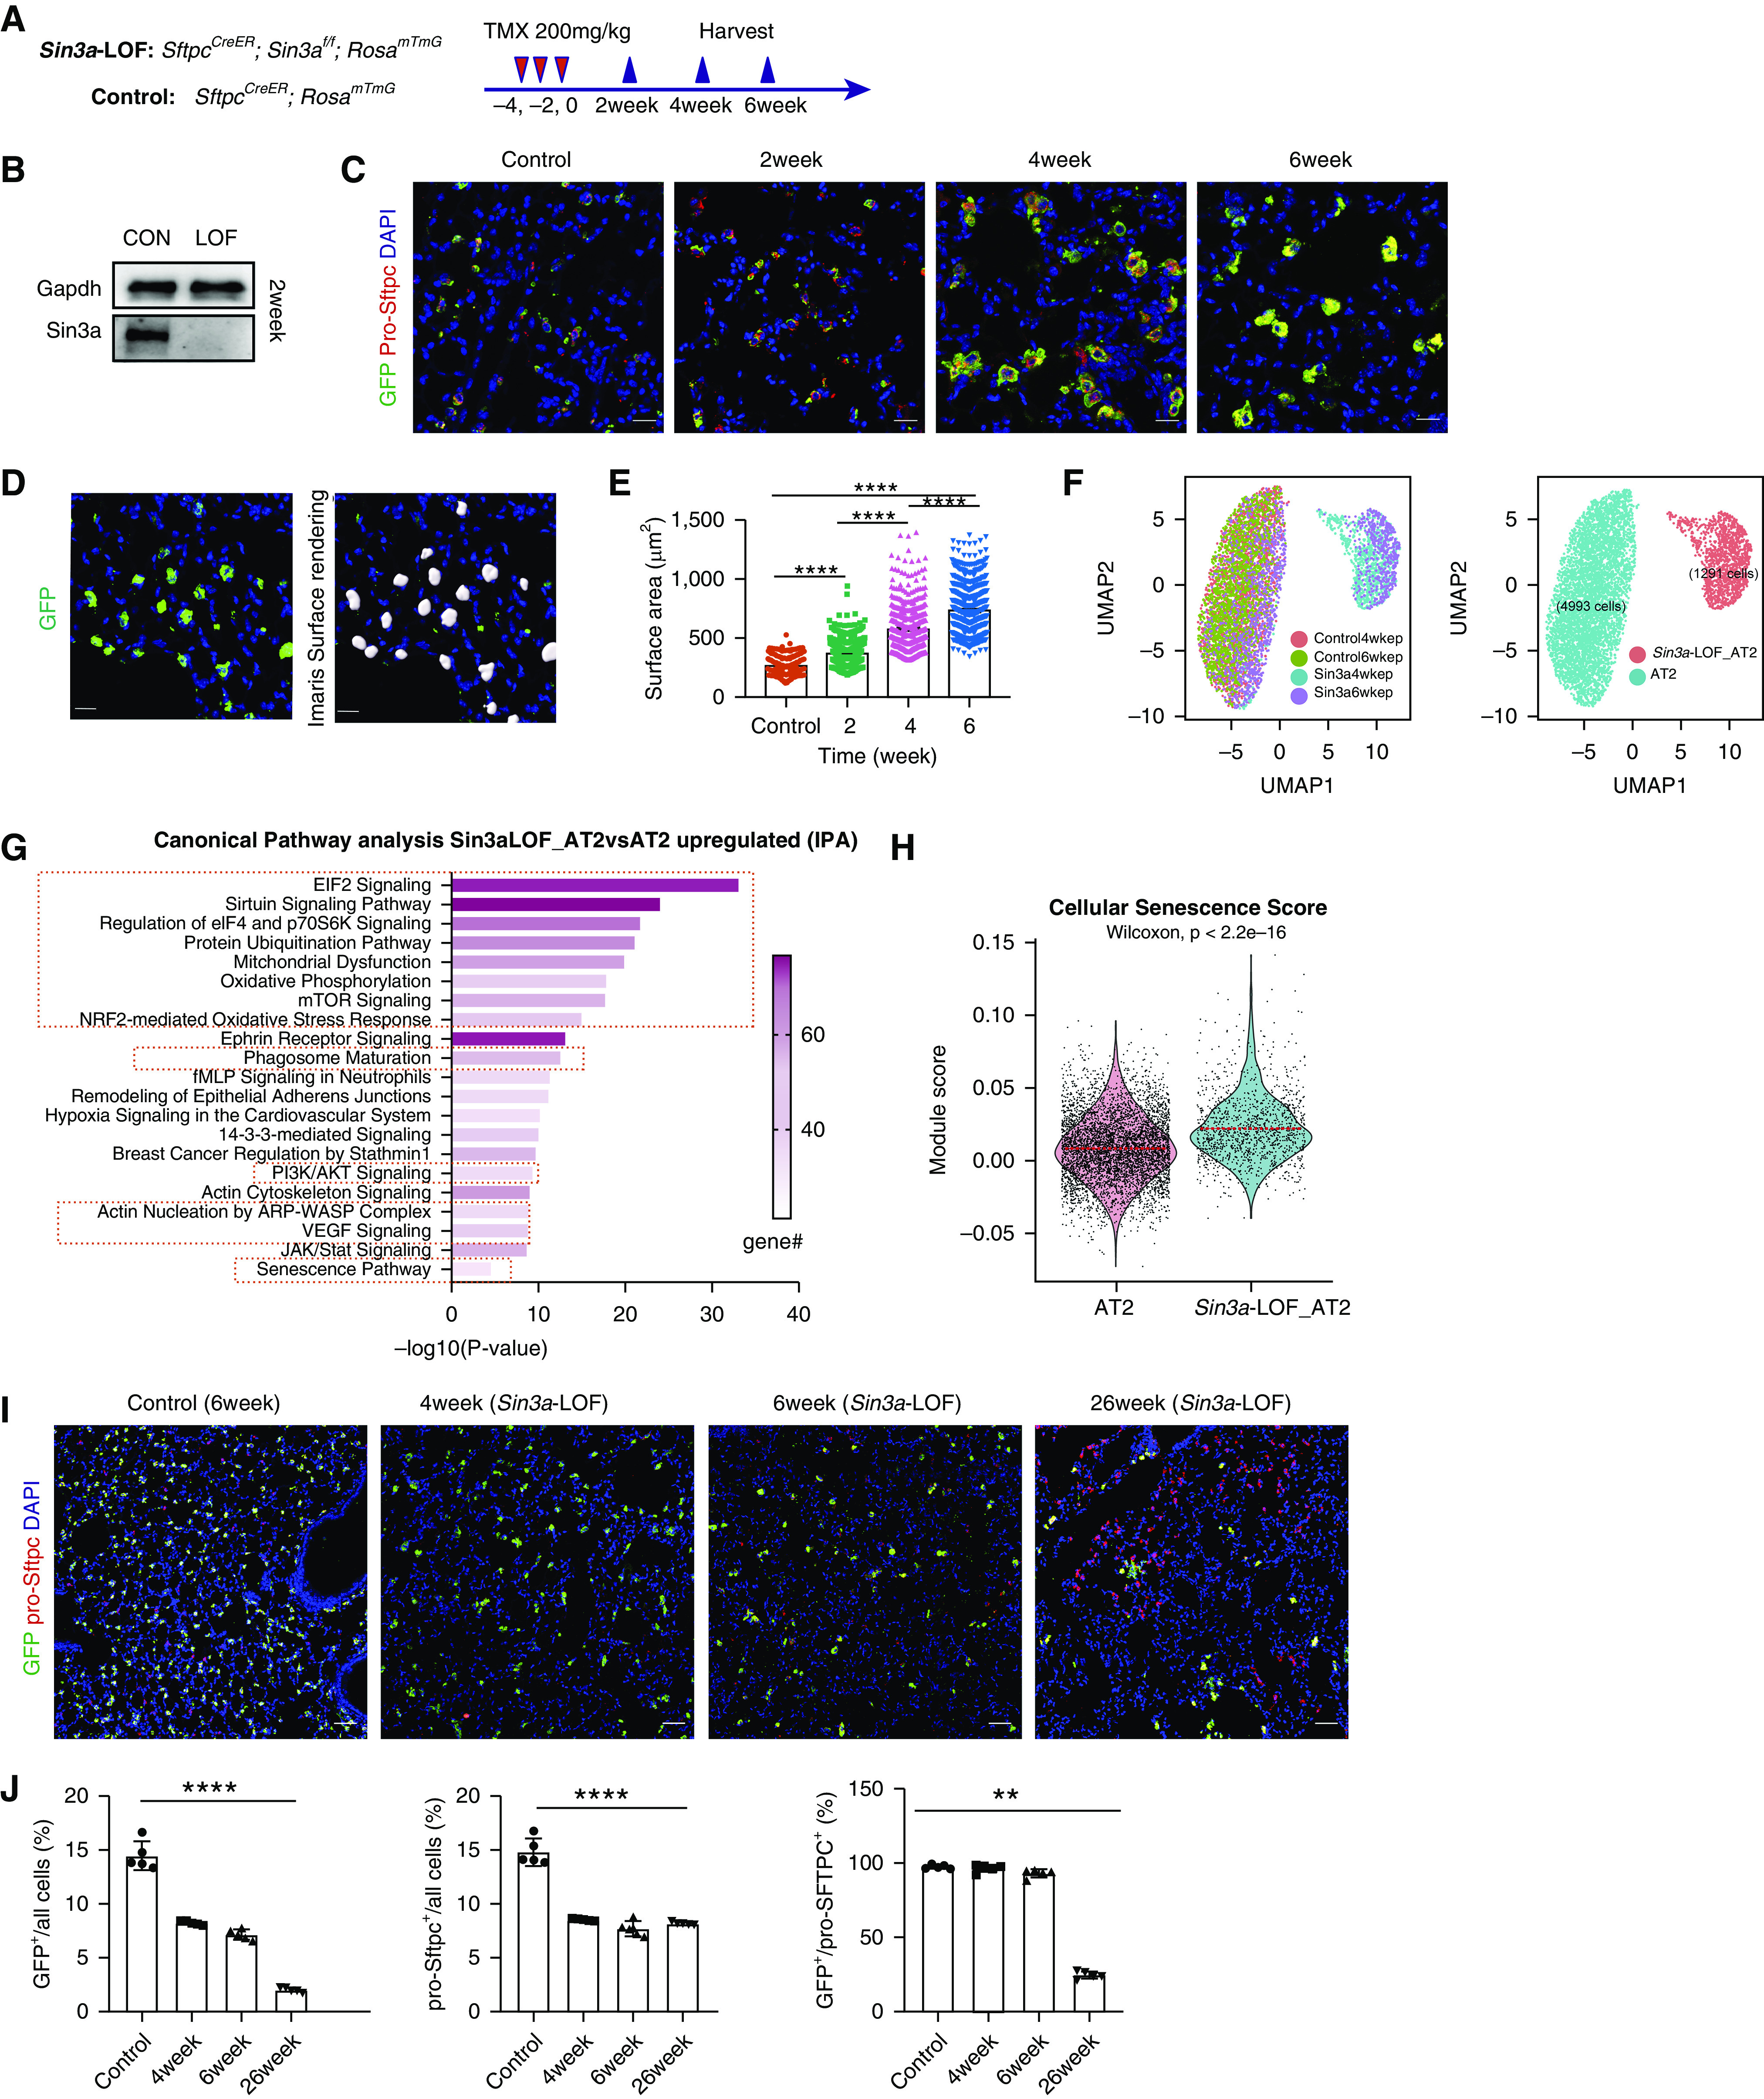
Figure 2.

Loss of Sin3a in adult mouse alveolar type 2 (AT2) cells leads to cellular senescence. (A) Schematic outline of experiment design. (B) Western blot detection of Sin3a knockout efficiency in isolated AT2 cells 2 weeks after tamoxifen treatment. (C) Time course of immunofluorescence staining for lineage reporter-GFP (green fluorescent protein) and pro-Sftpc in control and Sin3a-LOF (Sin3a loss of function) lung. Scale bars, 20 μm. (D) Representative immunofluorescence staining of membrane-bound GFP and Imaris surface rendering for surface area quantification. Scale bars, 20 μm. (E) AT2 cell surface area quantification. (F) Uniform manifold approximation and projection (UMAP) visualization of AT2 cell subset, origin, and clustering from mouse epithelial cell single-cell RNA sequencing. (G) Ingenuity Pathway Analysis canonical pathway analysis of genes upregulated in AT2 cells of Sin3a-LOF compared with control; senescence pathway and senescence-related pathways are highlighted. (H) Violin plot visualization of cellular senescence score based on core senescence genes comparing Sin3a-LOF AT2 cells with control AT2 cells. The dashed line indicates the median value of each group. (I) Representative immunofluorescence staining of lineage reporter gene (GFP) and pro-Sftpc, comparing lung tissue of control with Sin3a-LOF at different times after tamoxifen exposure. Scale bars, 20 μm. (J) Quantification of percentage of either lineage reporter GFP+ cells, pro-Sftpc+ cells, or the ratio of GFP+/pro-Sftpc+ cells as a function of total cells within a section of lung lobe of Sin3a-LOF mice over the time course. Control samples are SftpcCreER and RosamTmG mice 6 weeks after tamoxifen treatment. P values were calculated by nonparametric Mann-Whitney test. **P < 0.01 and ****P < 0.0001. CON = control; IPA = Ingenuity Pathway Analysis.
