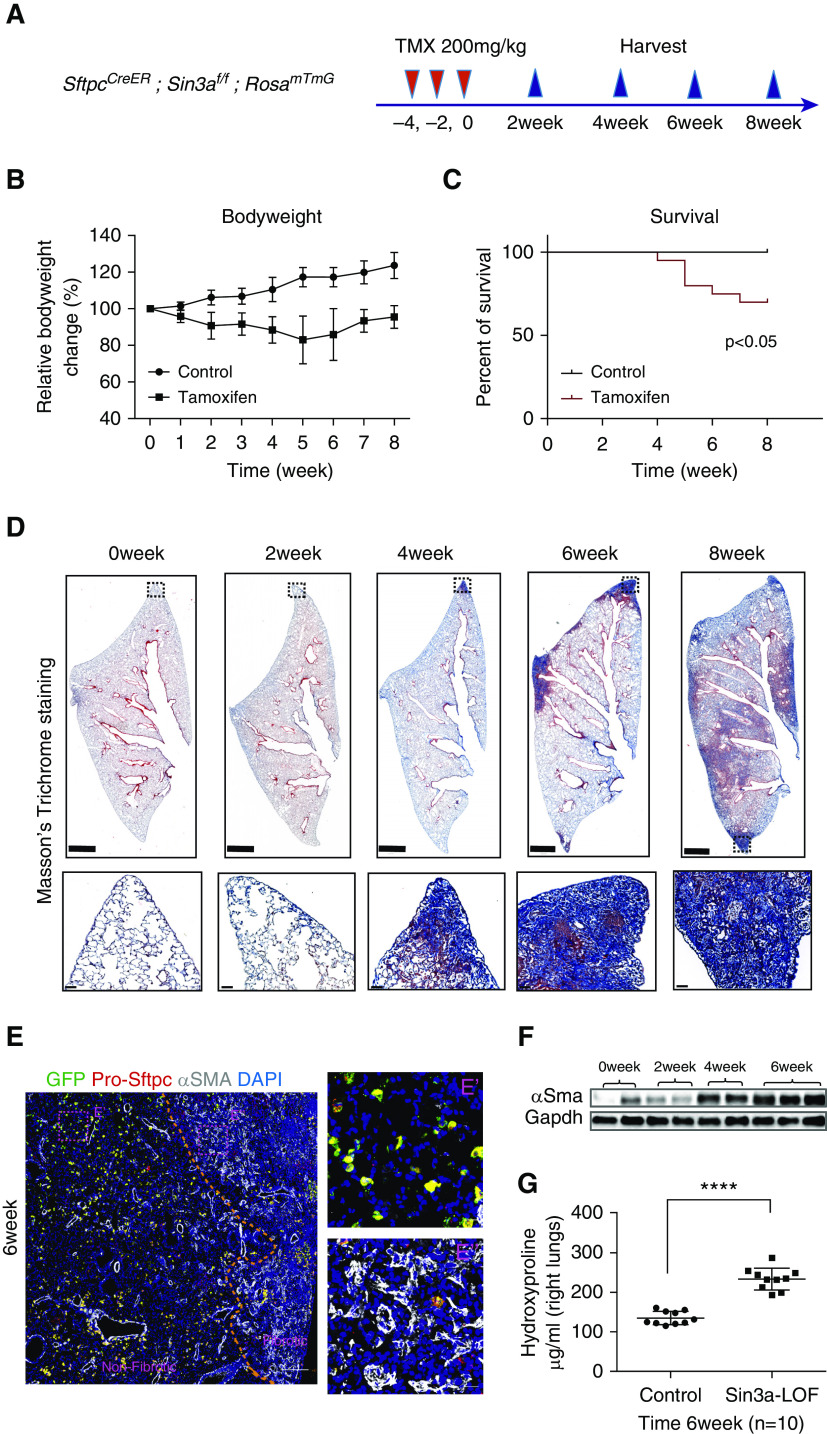
Figure 3.
Loss of Sin3a in alveolar type 2 cells leads to progressive lung fibrosis. (A) Schematic outline of experiment design. (B) Body weight change for tamoxifen-exposed Sin3a-LOF (Sin3a loss of function) and control mice. (C) Survival curve for tamoxifen-exposed Sin3a-LOF and control mice. The P value was calculated by log-rank (Mantel-Cox) survival analysis. (D) Time course of Masson’s trichrome staining of lung tissue from tamoxifen-exposed Sin3a-LOF and control mice. Squares indicate zones of magnified images. Scale bars: top, 1 mm; bottom, 50 μm. (E) Representative immunofluorescence staining of Sin3a-LOF lung tissue 6 weeks after tamoxifen exposure for lineage reporter-GFP (green fluorescent protein), pro-Sftpc, and αSMA. The dashed line represents the boundary between fibrotic and nonfibrotic tissue. E′ and E″ are magnified images of representative regions from either nonfibrotic or fibrotic tissue. Scale bars: E, 200 μm; E′ and E″, 20 μm. (F) Western blot detection of αSMA abundance within lung tissue of Sin3a-LOF mice. (G) Hydroxyproline content of right lung between Sin3a-LOF and control mice 6 weeks after tamoxifen exposure (n = 10 for each group). The P value was calculated by two-tailed Student’s t test. ****P < 0.0001.

