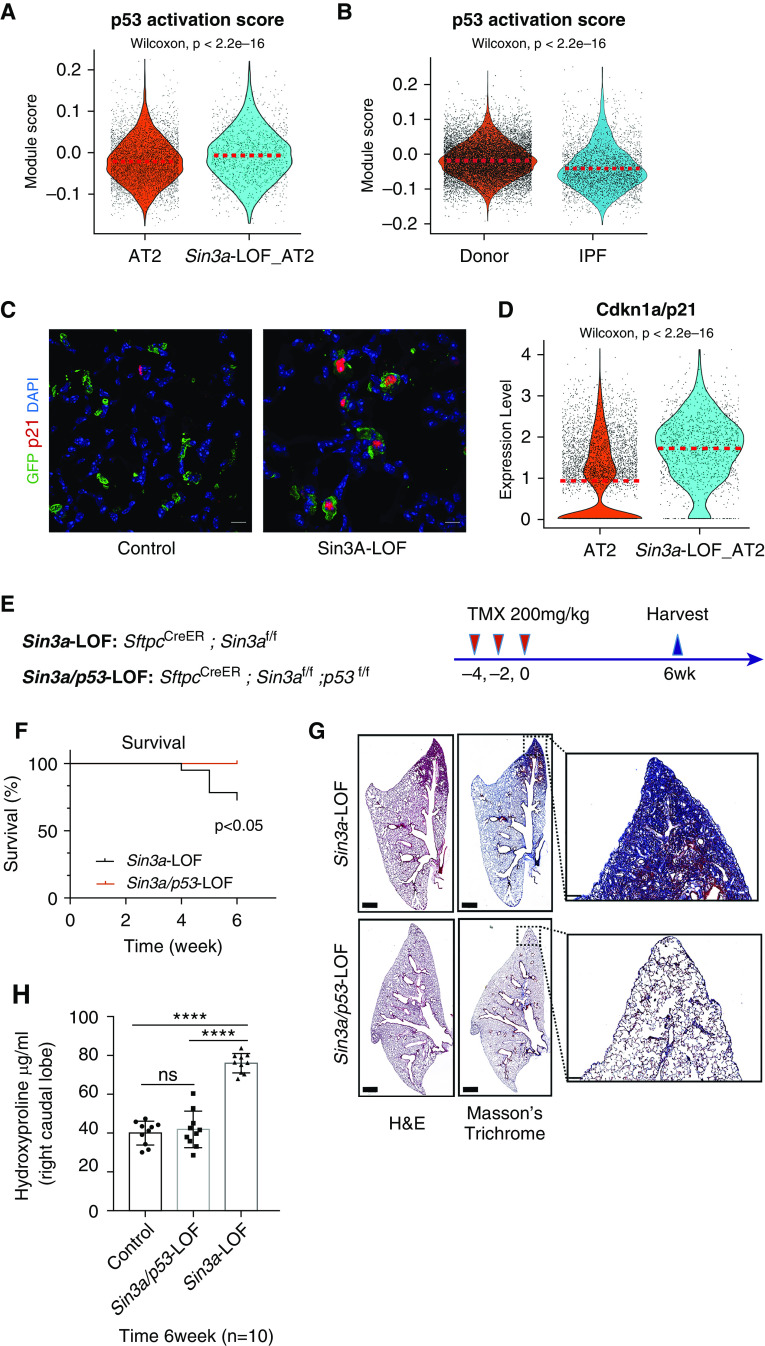
Figure 4.
p53 pathway activation in Sin3a-LOF (Sin3a loss of function) alveolar type 2 (AT2) cells. (A) Violin plot visualization of p53 activation score calculated using p53 Kyoto Encyclopedia of Genes and Genomes pathway genes of the mouse single-cell RNA sequencing (scRNA-Seq) AT2 cell subset. The dashed line indicates the median value of each group. (B) Violin plot visualization of p53 activation score of the human scRNA-Seq AT2 cell subset. The dashed line indicates the median expression of each group. (C) Representative immunofluorescence staining of lineage reporter-GFP (green fluorescent protein) and Cdkn1a/p21, comparing control lung tissue with Sin3a-LOF 6 weeks after tamoxifen exposure. Scale bars, 10 μm. (D) Violin plot representation showing relative expression of Cdkn1a/p21 in mouse scRNA-Seq AT2 subset. The dashed line indicates the median expression of each group. (E) Schematic outline of experiment design for p53-LOF studies. (F) Survival curve for Sin3a-LOF and Sin3a/p53-LOF groups 6 weeks after tamoxifen treatment. The P value was calculated by log-rank (Mantel-Cox) survival analysis. (G) Hematoxylin and eosin and Masson’s trichrome staining of Sin3a-LOF and Sin3a/p53-LOF lung tissues 6 weeks after tamoxifen treatment. Squares indicate zones of magnified images. (H) Hydroxyproline content of right caudal lobe in Sin3a-LOF and Sin3a/p53-LOF mice 6 weeks after tamoxifen treatment (n = 10 for each group). P values were calculated by two-tailed Student’s t test. ****P < 0.0001. H&E = hematoxylin and eosin; IPF = idiopathic pulmonary fibrosis; ns = not significant.

