
Figure 5.
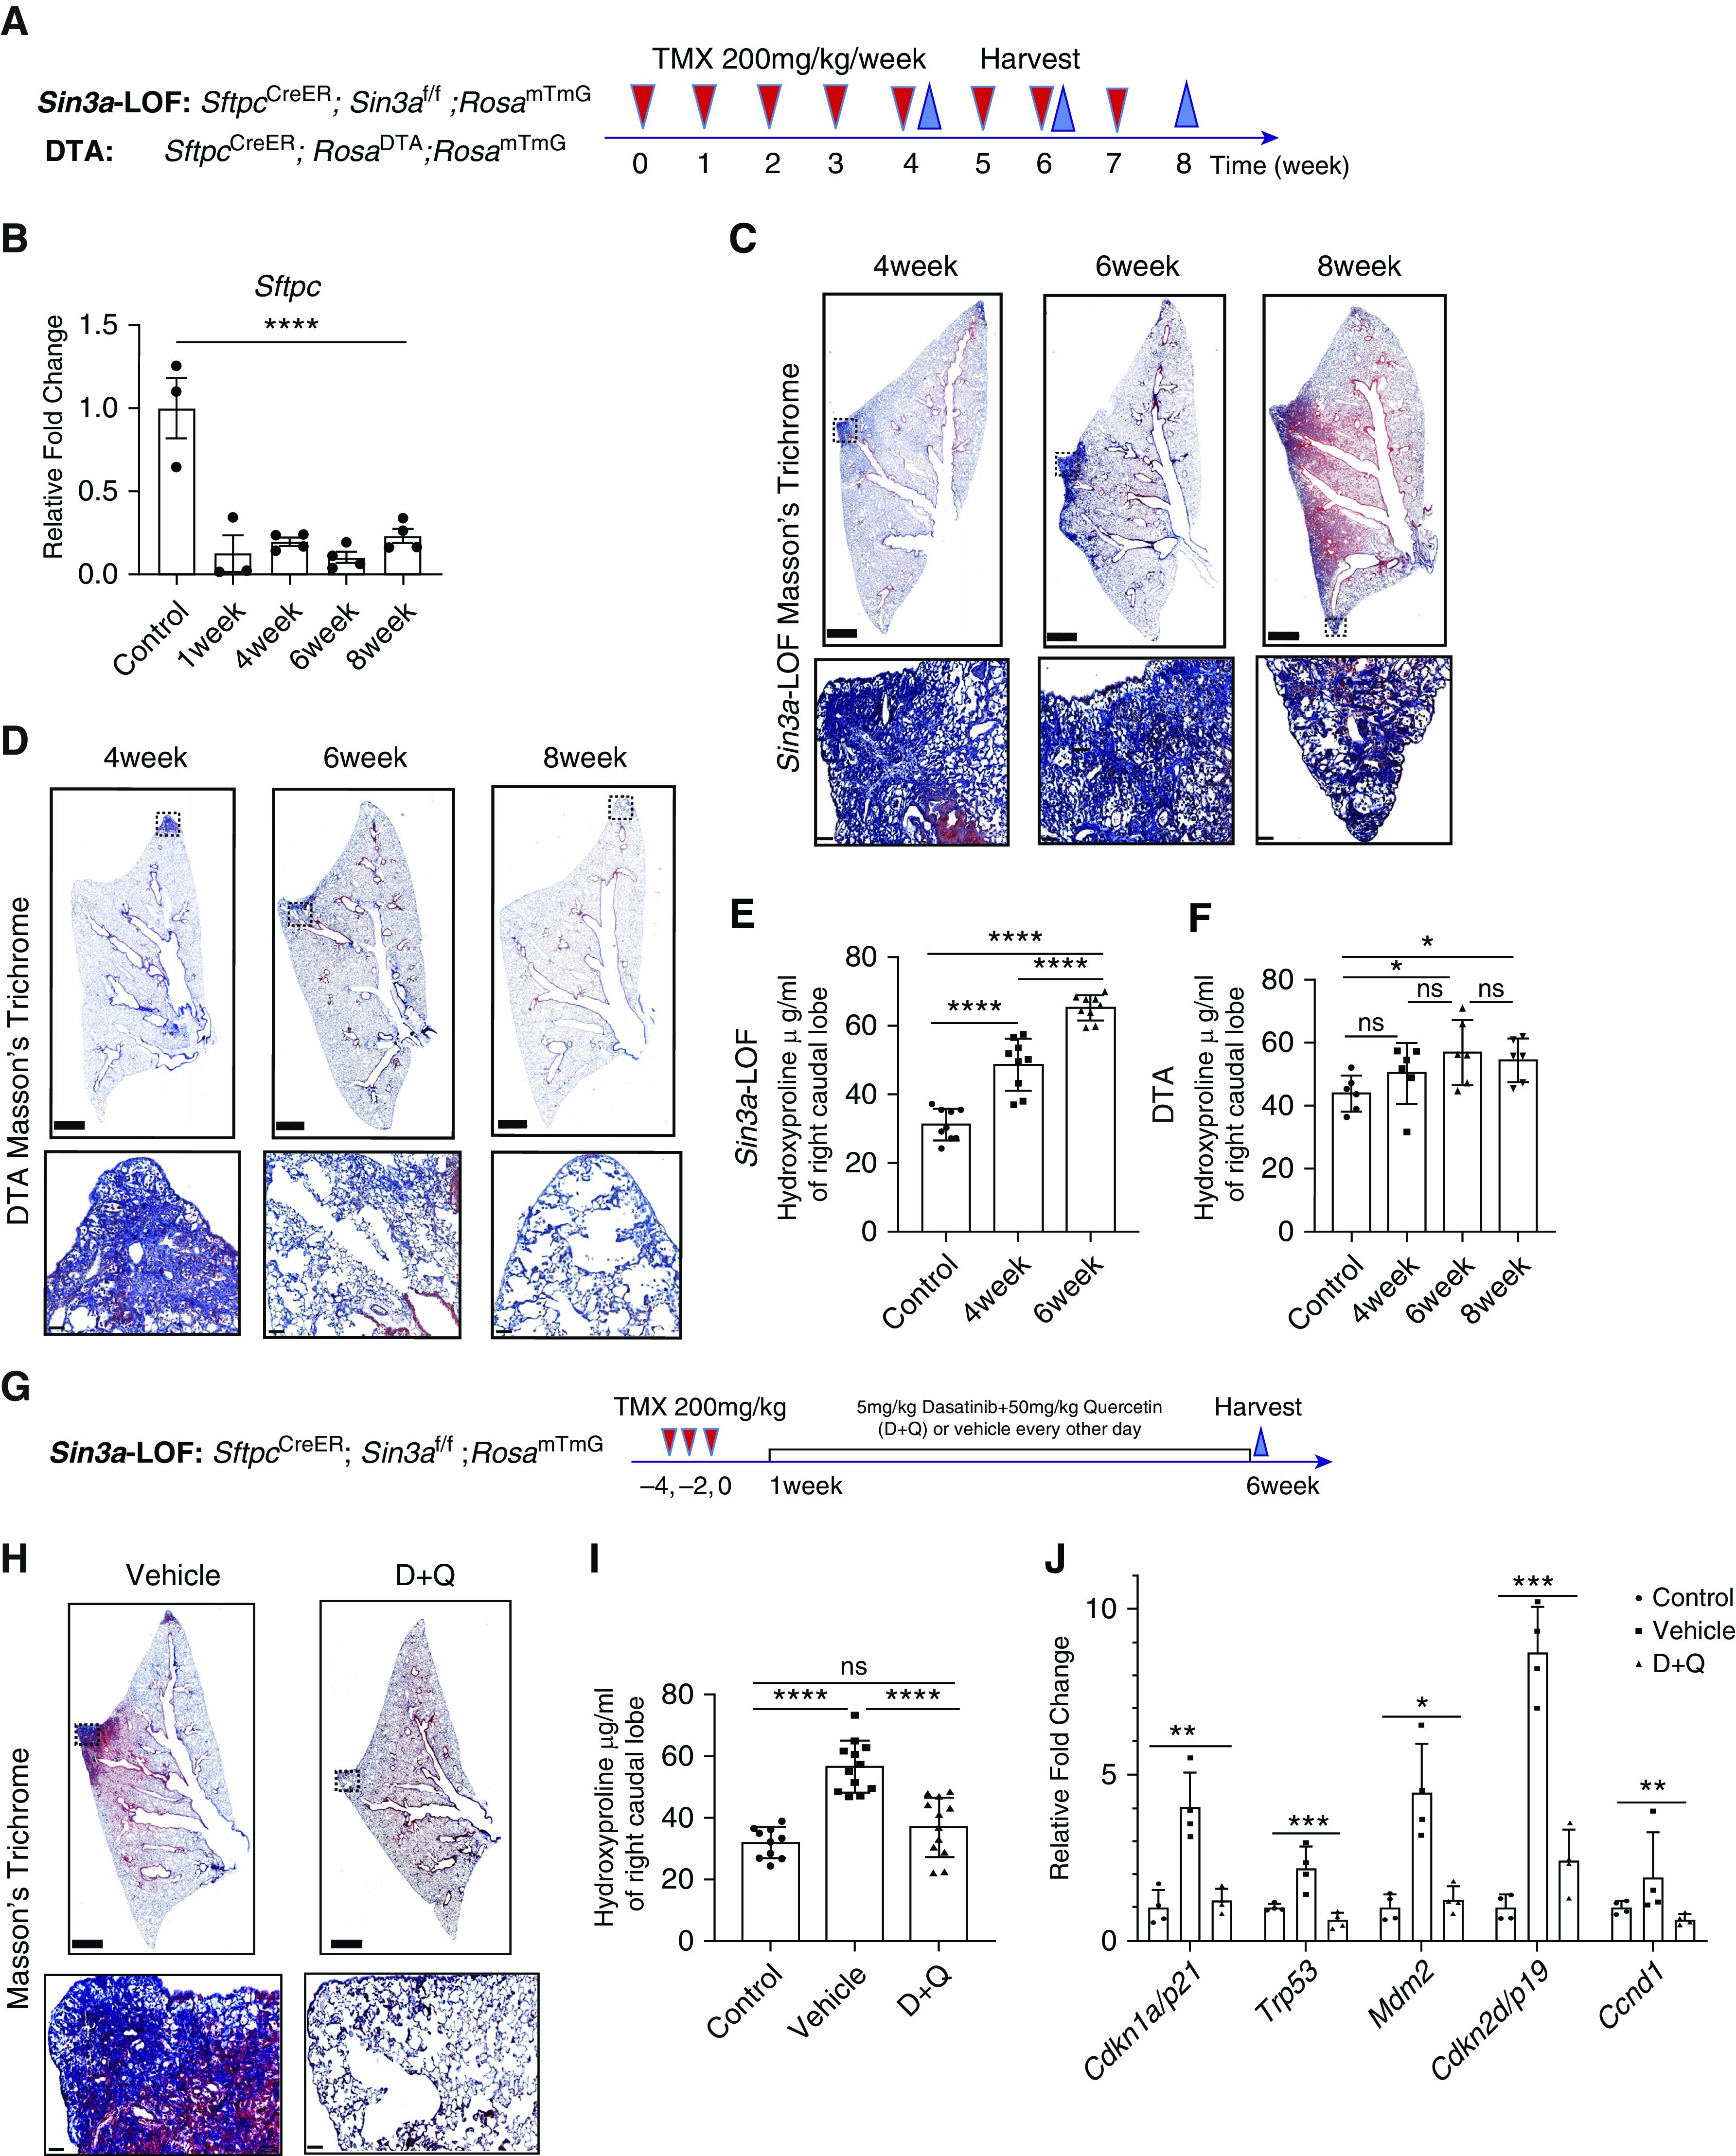
Senescence rather than loss of alveolar type 2 (AT2) cells results in progressive lung fibrosis. (A) Schematic outline of experiment design for AT2 cell ablation. (B) Quantitative PCR of control and diphtheria toxin A (DTA) mouse lung tissues for relative changing expression of Sftpc, indicating AT2 cell ablation efficiency (n > 3). (C) Masson’s trichrome staining of Sin3a-LOF (Sin3a loss of function) mice after repeated tamoxifen treatment. Squares indicate zones of magnified images. Scale bars: top, 1 mm; bottom, 50 μm. (D) Masson’s trichrome staining of DTA mice after repeated tamoxifen treatment. Squares indicate zones of magnified images. Scale bars: top, 1 mm; bottom, 50 μm. (E) Hydroxyproline content in the right caudal lobe of Sin3a-LOF mice after 4 and 6 weeks repeated exposure of tamoxifen and control groups. (F) Hydroxyproline content in the right caudal lobe of DTA mice after 4, 6, and 8 weeks repeated exposure of tamoxifen and control groups. (G) Schematic outline of experiment design for senolytic drug treatment. (H) Masson’s trichrome staining of Sin3a-LOF mice 6 weeks after tamoxifen treatment comparing 5 mg/kg dasatinib and 50 mg/kg quercetin (D+Q) cocktail treatment and vehicle treatment groups. Squares indicate zones of magnified images. Scale bars: top, 1 mm; bottom, 50 μm. (I) Quantitative PCR of isolated AT2 cells from control, vehicle-treated, and D+Q-treated Sin3a-LOF mouse lung tissues for relative changing expression of senescence markers indicating senolytic drug treatment efficiency (n = 4). (J) Hydroxyproline content in right caudal lobe of Sin3a-LOF mice treated with either D+Q or vehicle 6 weeks after tamoxifen treatment (n > 10 for each group). P values were calculated by nonparametric Mann-Whitney test (comparison of two groups) or Kruskal-Wallis test (comparison of more than two groups). *P < 0.05, **P < 0.01, ***P < 0.001, and ****P < 0.0001. ns = not significant.