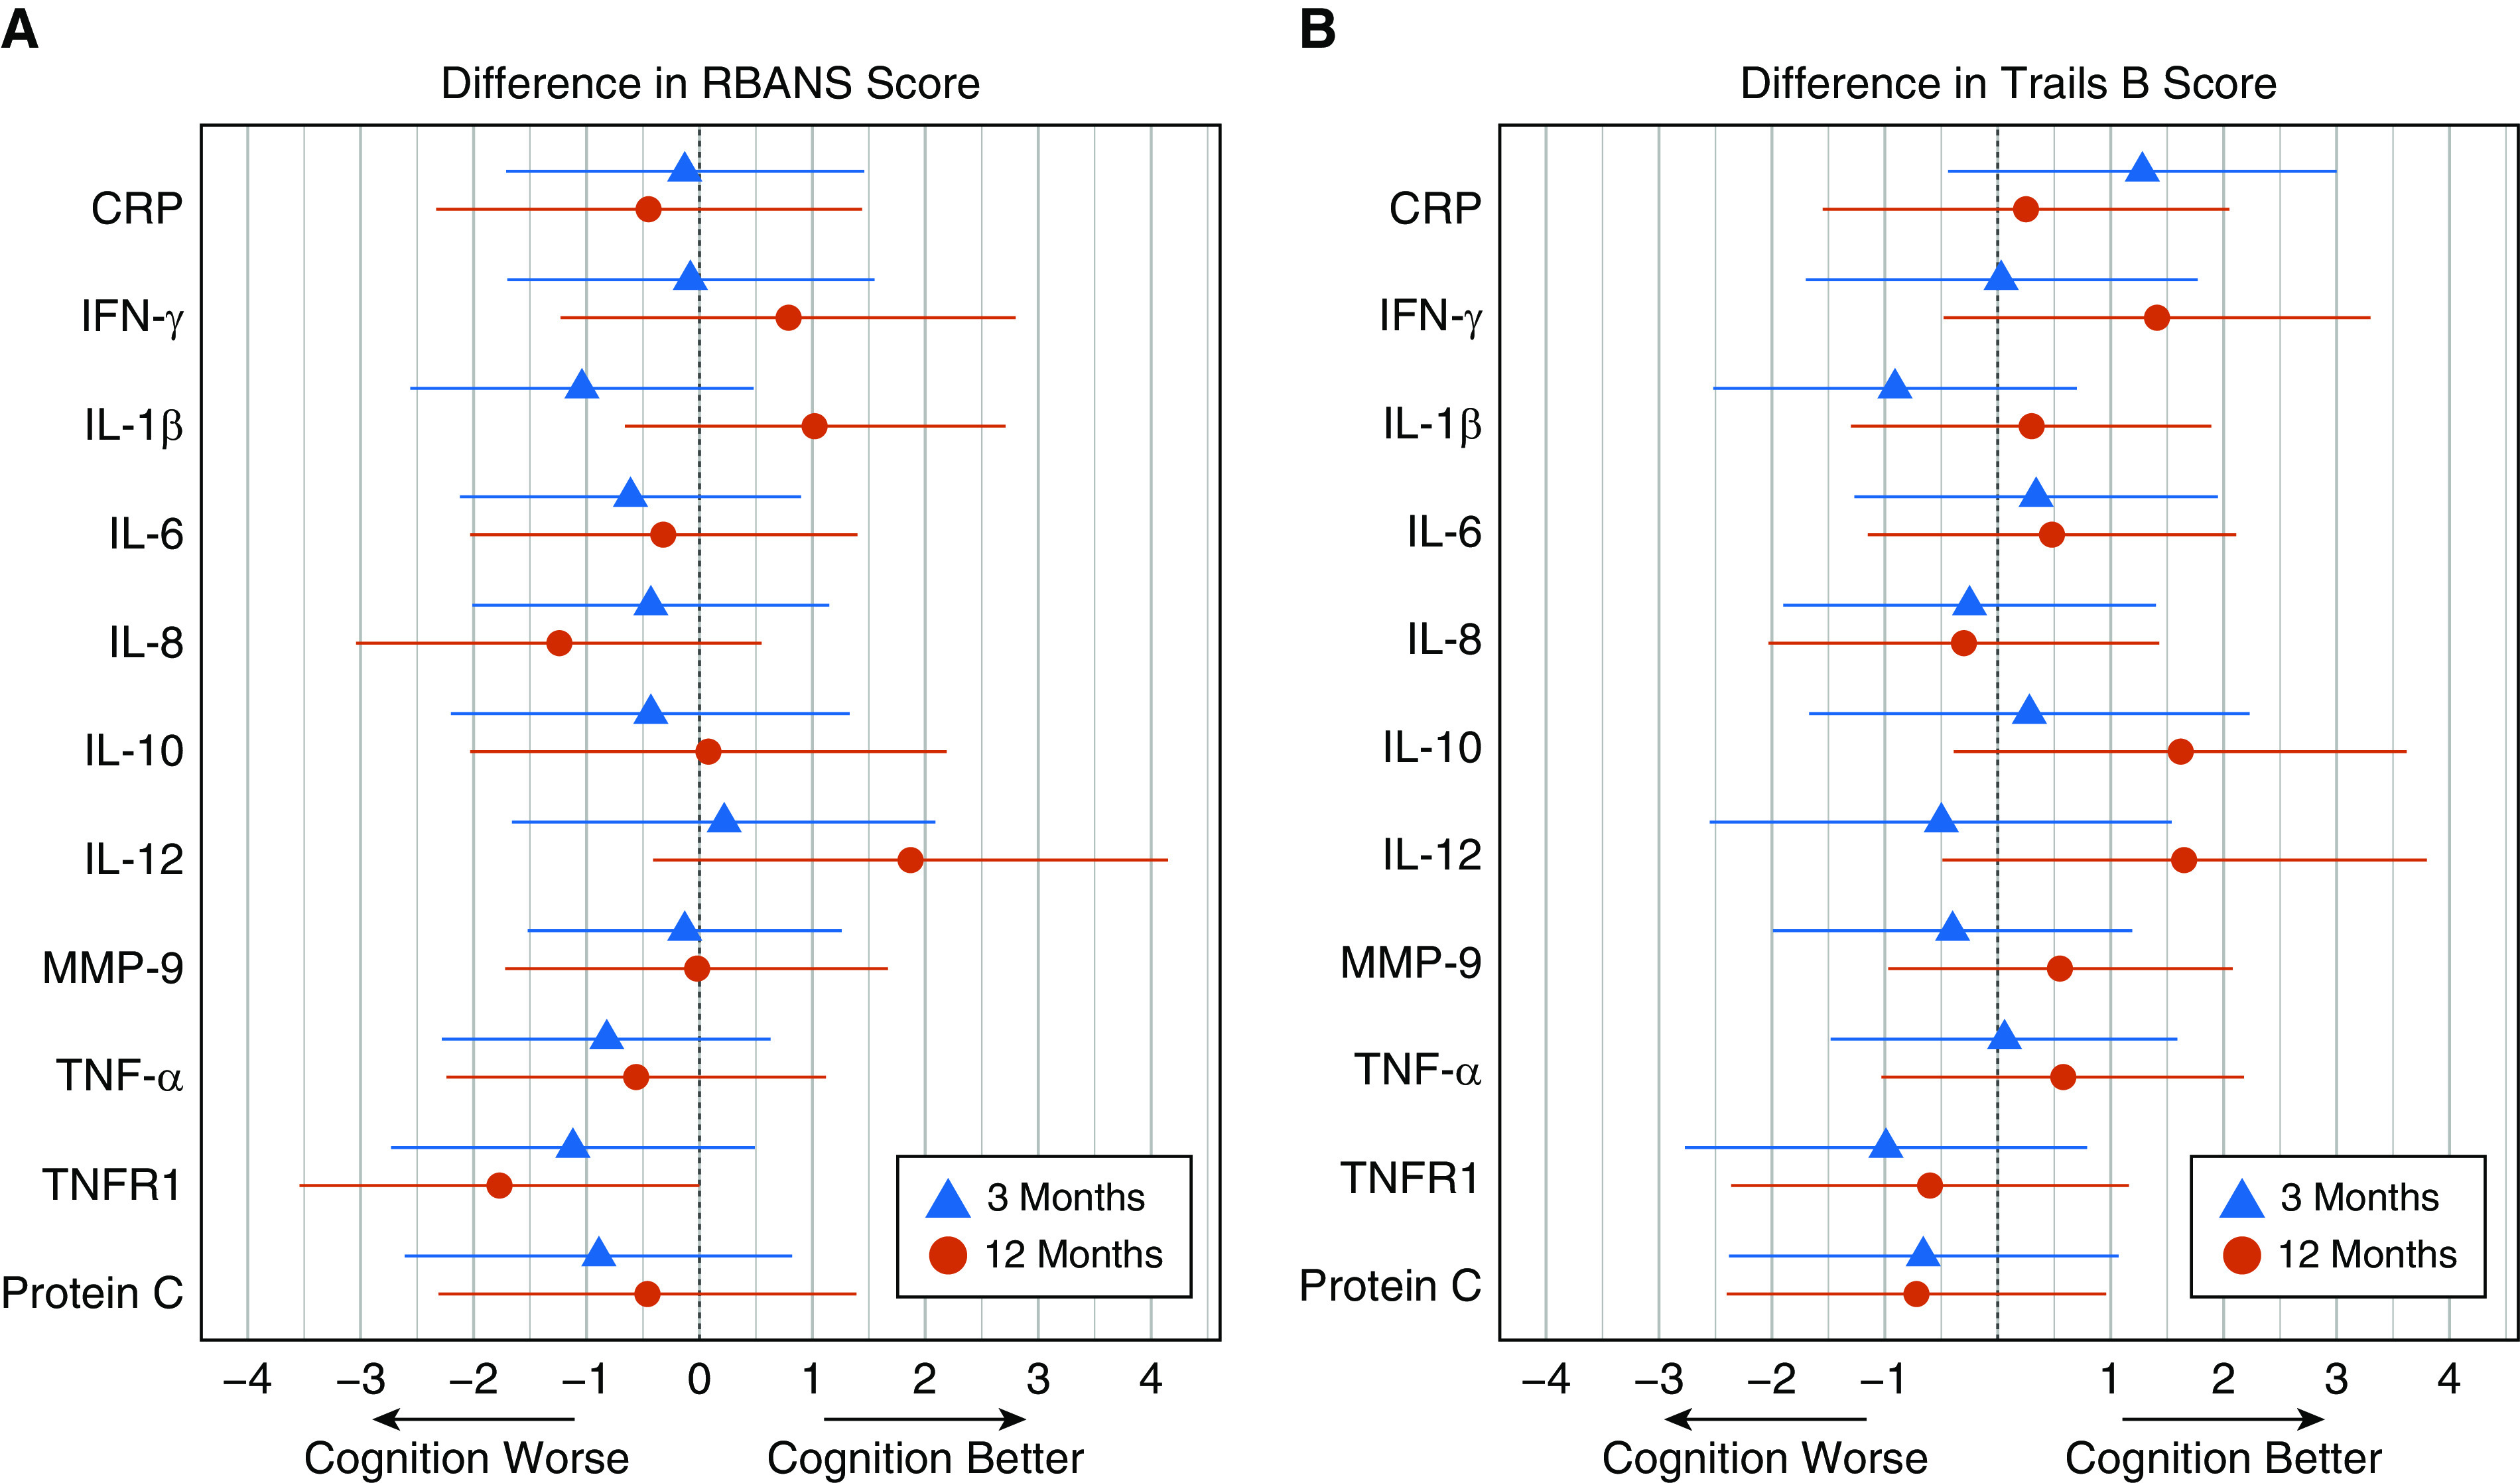
Figure 2.

Associations of markers of inflammation and coagulation with long-term cognition. These figures display the difference in score on the (A) RBANS or (B) Trails B tests for each of the 11 biomarkers of interest. Blue triangles represent the point estimate at 3 months and red circles represent the point estimate at 12 months. Horizontal lines represent the 95% confidence interval. Each comparison is of participants with biomarker concentration at the 75th percentile to participants with a biomarker concentration at the 25th percentile, with all covariates adjusted to their mean or mode value. Negative changes in scores (i.e., point estimates to the left of 0) represent worse cognitive function. CRP = C-reactive protein; MMP = matrix metalloproteinase; RBANS = Repeatable Battery for the Assessment of Neuropsychological Status; TNF = tumor necrosis factor; TNFR = tumor necrosis factor receptor; Trails B = Trail Making Test Part B.
