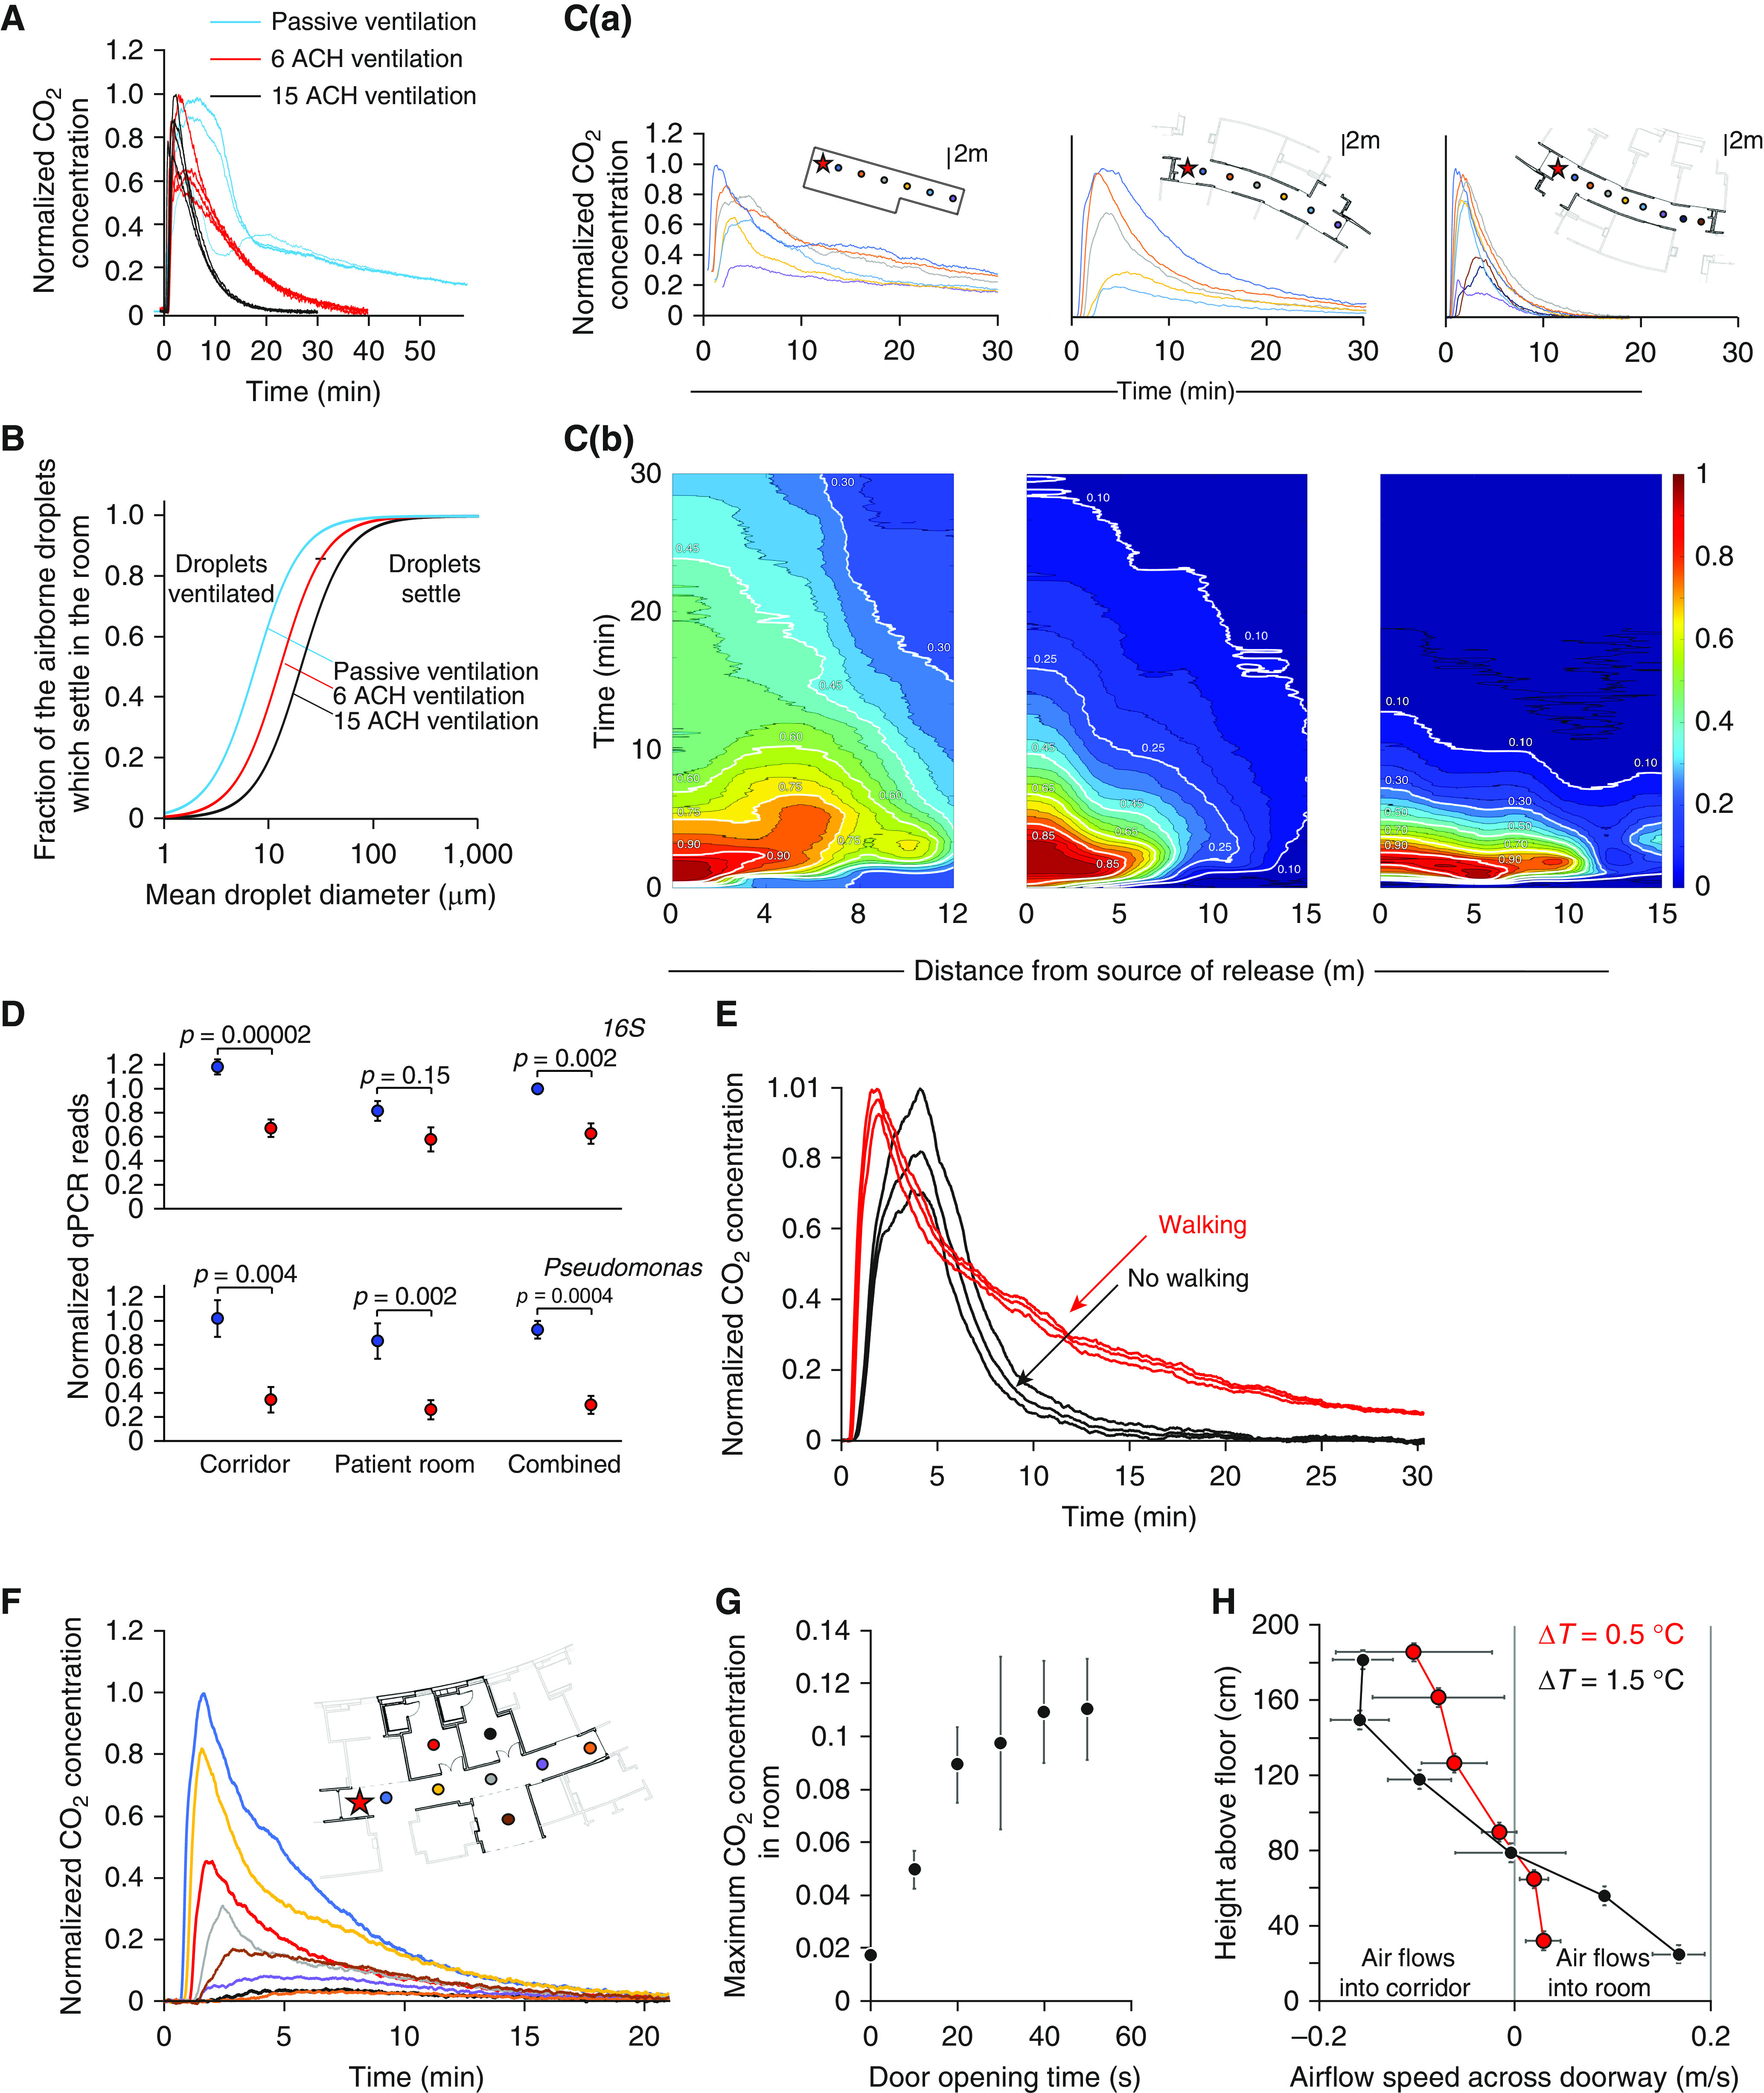
Figure 1.

The impact of ventilation on air-handling in hospitals. (A) Concentrations of tracer gas (CO2) monitored over time after a pulse release in three patient rooms with 15 air changes per hour (ACH) (black line) within New Papworth Cystic Fibrosis Centre, 6 ACH (red line) within New Papworth Hospital, or passive ventilation (blue line) from Old Papworth Hospital. The concentrations normalized to the maximum recorded value. (B) Model prediction of the fraction of airborne droplets that sediment to the floor or are ventilated in a patient room as a function of mean droplet diameter, shown for rooms passively ventilated (blue) or with 6 (red) or 15 (black) ACH. (C) Variations in normalized CO2 concentration after tracer release (at the point marked by a star) measured by sensors located along ward corridors (as shown in floor plans) in Old Papworth Hospital under passive ventilation (left) and in New Papworth Hospital in areas with ventilation with 6 ACH (middle) or ventilation with 15 ACH (right). (Ca) Normalized CO2 concentrations detected over time by each sensor. (Cb) Normalized CO2 concentrations as a distance–time plot. (D) Comparison of the relative amounts of total bacteria (16S) (quantified by qPCR) detected in air samples from ward corridors and unoccupied rooms in Old Papworth Hospital (blue) under passive ventilation, compared with equivalent areas in New Papworth Hospital receiving ventilation with 15 ACH (red) during periods of similar ward-bed occupancy levels. (E) CO2 concentrations over time after tracer release in a corridor with ventilation with 15 ACH, in the presence (red) or absence (black) of people walking along it. (F) CO2 concentrations over time after tracer released in the corridor (red star) measured by sensors deployed along the corridor and inpatient rooms. (G) Peak CO2 concentrations detected in rooms (expressed as a fraction of maximum corridor concentration) as a function of the time the doorway is kept open. (H) Variation of the airflow speed across a doorway as a function of height above the floor (quantified from a video of smoke released from an Artic Hayes pen) when the room is 0.5°C (red) or 1.5°C (black) hotter than the corridor. ΔT = change in temperature; qPCR = quantitative PCR.
