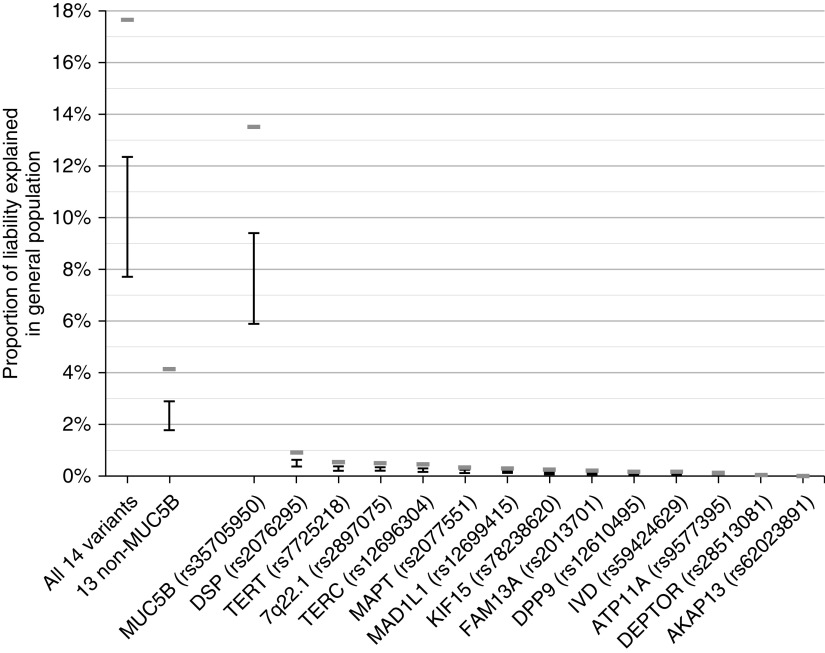
Figure 1.
Proportion of liability explained in the general population. Estimated proportion of variation explained is taken from the liability R2 from the regression analyses with the lower bound given when assuming a disease prevalence of 1.25 cases per 100,000 and the upper bound given when assuming a disease prevalence of 63 cases per 100,000. The gray bars show the estimated proportion of liability explained when assuming the disease prevalence in people >65 years of age of 495 cases per 100,000. The x-axis label “All 14 variants” refers to the model including all 14 sentinel idiopathic pulmonary fibrosis (IPF) susceptibility variants; “13 non-MUC5B” refers to the model including all sentinel IPF susceptibility variants minus the MUC5B polymorphism rs35705950. Variants are ordered by the proportion of explained variation.

