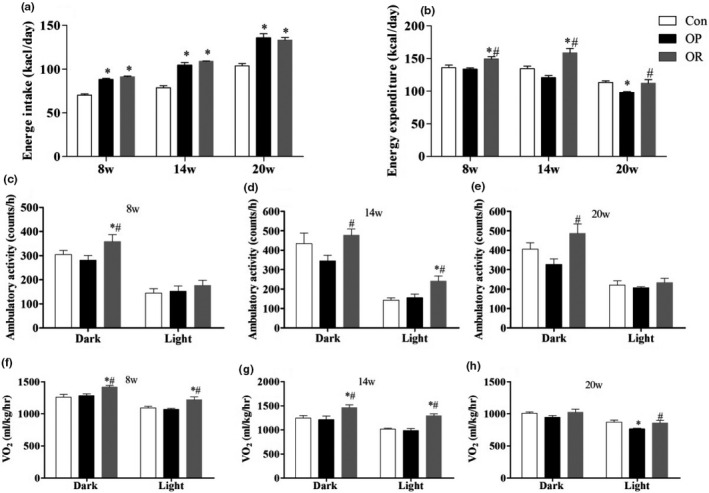
FIGURE 2.

Indirect calorimetry in Con, OP and OR rats in the 8th week, 14th, and 20th week. (a) Energy intake, (b) Energy expenditure, (c‐e) Ambulatory activity, (f‐h) Oxygen consumption. Bar graphs represent mean values during the light and dark cycles. Data were presented as mean ± SEM. Con, control group; OP, obesity‐prone; OR, obesity‐resistant. *p < .05 versus Con; #w p < .05 versus OP
