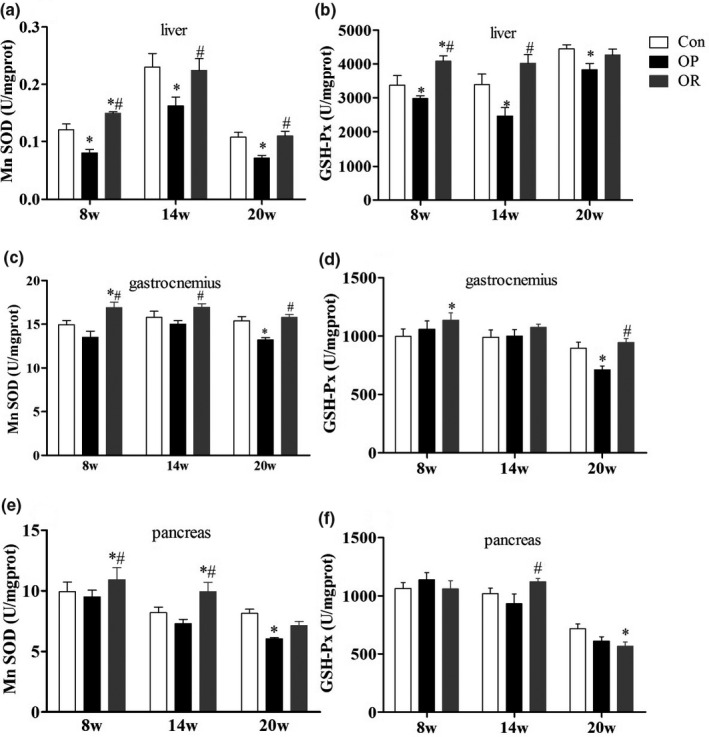
FIGURE 3.

Differences of mitochondrial antioxidant enzymes among Con, OP, and OR rats. (a‐b) liver, (c‐d) gastrocnemius, (e‐f) pancreas. Data were presented as mean ± SEM. Con, control group; OP, obesity‐prone; OR, obesity‐resistant. *p < .05 versus Con; # p < .05 versus OP
