FIGURE 7.

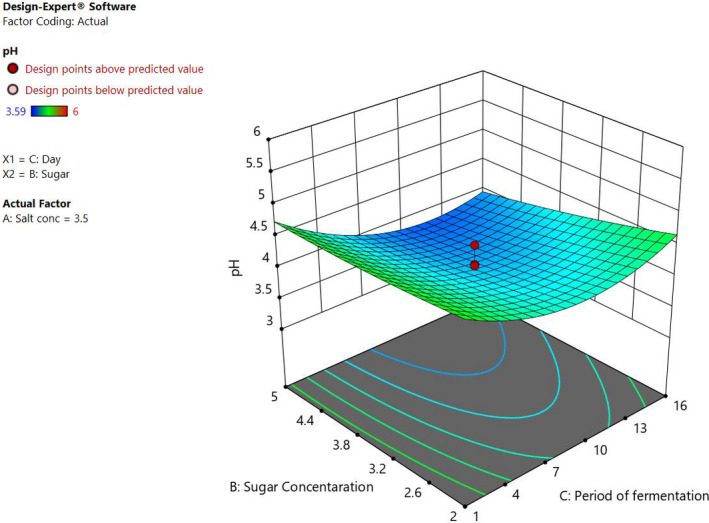
Three dimensional response surface plots showing the interactive effect of the concentrations of sugar and period of fermentation at 3.5% salt concentration

Three dimensional response surface plots showing the interactive effect of the concentrations of sugar and period of fermentation at 3.5% salt concentration