
FIGURE 1.
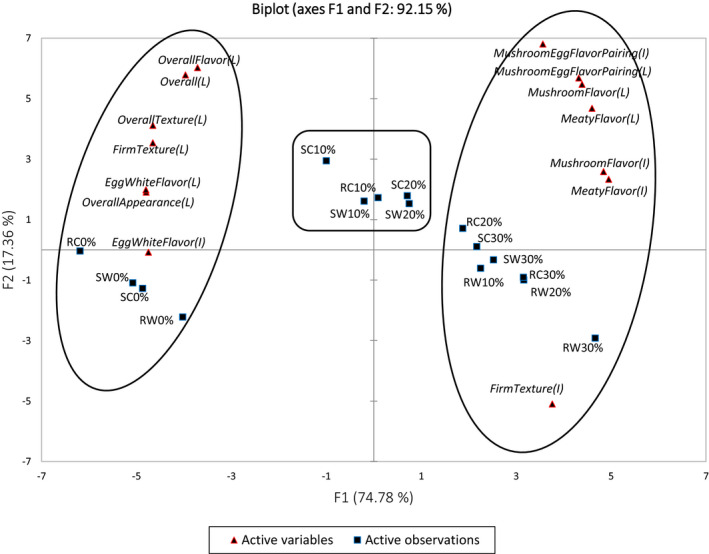
Principal component analysis (PCA) biplot of mean scores of 14 attribute ratings across 16 mushroom–egg white patties. C, Crimini mushroom; I, Intensity; L, liking; R, Roasted; S, Steamed; W, White mushroom. According to XLSTAT PCA output of “Squared cosines of the variables” and “Squared cosines of the observations,” two big oval circles were created based on variables (attributes) and observations (samples) were significantly separated from other samples either at positive or negative side of PC1. The rectangle was created based on variables (attributes) and observations (samples) were significantly separated from other samples at positive side of PC2