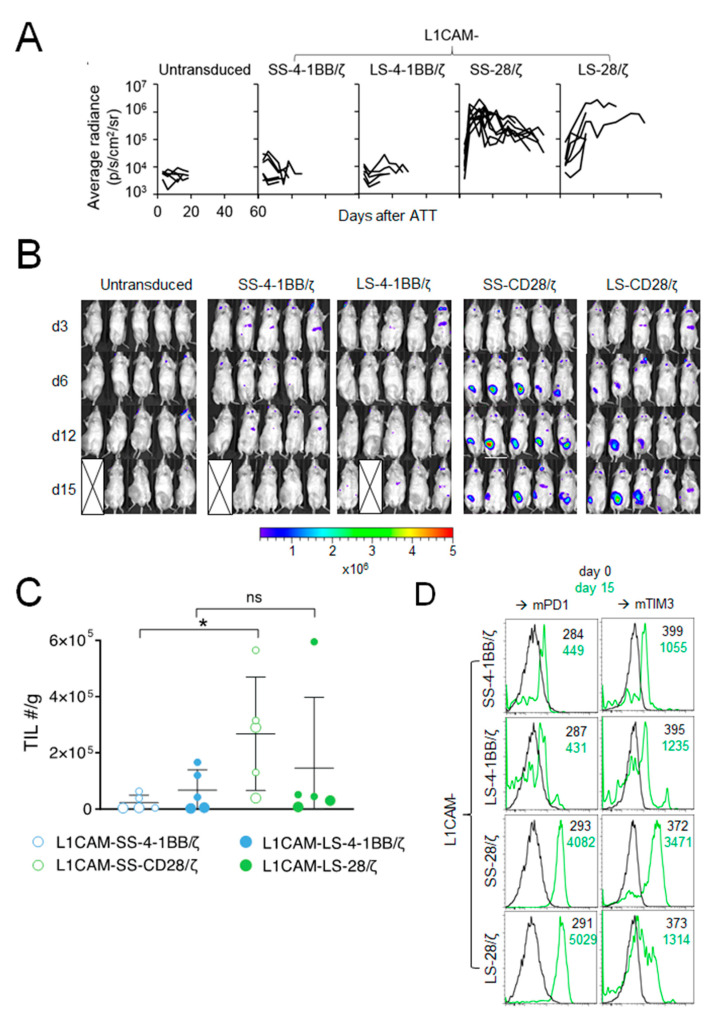
Figure 2.
The CD28 signaling domain enables L1CAM-specific CAR T cells with short and long spacer to expand at the tumor site. (A) Kinetic of the T cell signal (average radiance) detected at the tumor site over time is shown for mice from Figure 1C (L1CAM-SS-4-1BB/ζ (n = 6), L1CAM-LS-4-1BB/ζ (n = 5), L1CAM-SS-28/ζ (n = 9), L1CAM-LS-28/ζ (n = 6), untransduced (n = 5)). (B) Bioluminescent imaging data of mice shown in (A) on indicated time points following treatment (5 representative mice are shown for each group). The pseudo color scale indicates the intensity of the signal and is set from minimum 2 × 10⁵ to maximum 5 × 10⁶ p/s/cm2/sr. Data are representative of two independently performed experiments. (C) Mice were treated as described in (A) and were sacrificed on day 15. Tumors were harvested, T cells extracted and quantified. Total numbers (#) of TILs/g of tumors are depicted. Larger circles represent TILs of mice analyzed in (D). (D) TILs isolated from two mice of each treatment group shown in (C) were analyzed by flow cytometry for Pd1+ and Tim3+ expression and expression levels were compared to CAR T cells before infusion (d0). Black and green numbers within the graphs present mean fluorescent intensity (MFI) values of T cells before infusion and TILs isolated on day 15, respectively. Error bars represent SD, ns = not statistically significant *, p ≤ 0.05; TIL = tumor infiltrating lymphocytes.

