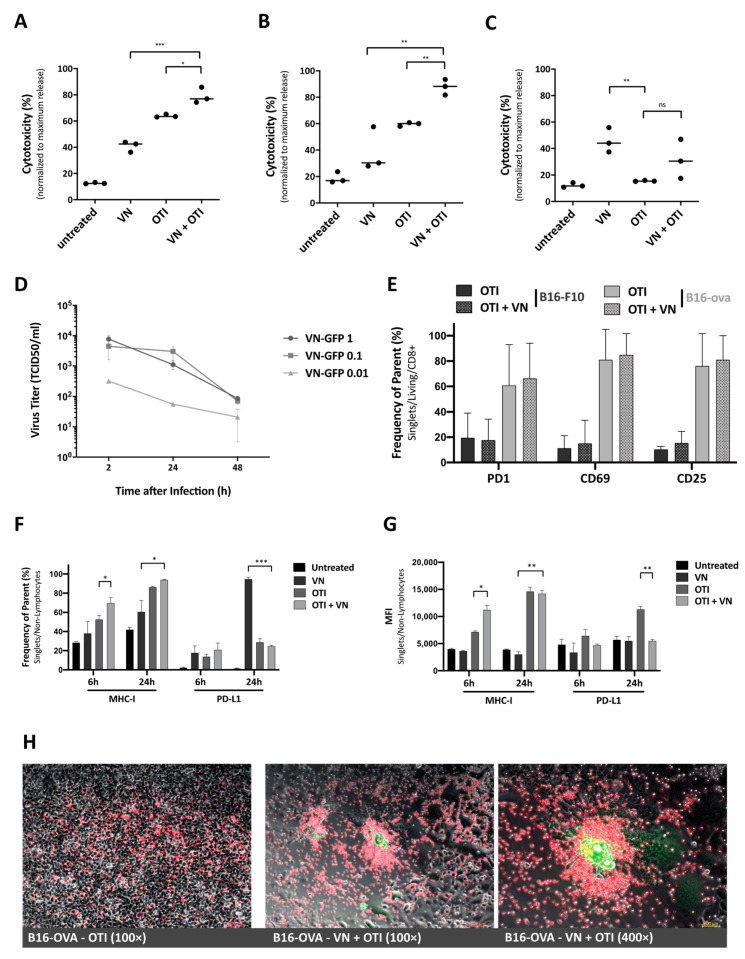
Figure 2.
In vitro effects of VSV-NDV and OTI T cell combination therapy. Co-culture experiments were performed by seeding B16 cells and pre-infecting them with VSV-NDV (VN) at MOI 0.1 for 8 h, before adding OTI T cells in a 1:1 effector-to-target ratio. Supernatant samples were collected (A) at 8 h after OTI addition to B16-OVA cells or (B) 16 h after OTI addition to a 1:1 mixed B16 melanoma (B16-OVA: B16-F10) cell population to determine cytotoxicity by LDH assay. (C) Additional co-culture experiments were performed using B16-F10 cells pre-infected with VSV-NDV for 24 h prior to addition of OTI cells and collecting supernatant for LDH assay 16 h later. (D) OTI T cells were infected with VSV-NDV at the indicated MOIs, and supernatant samples were collected 2, 24 and 48 h after infection for virus titer determination by TCID50. (E) OTI T cell activation in response to co-culture with/without VSV-NDV pre-infection in B16-OVA and B16-F10 cells was determined by measuring surface expression of PD1, CD69, and CD25 via flow cytometry. Co-culture experiments were performed by seeding B16 cells, pre-infecting them with VSV-NDV (VN) at MOI 0.01 for 16 h before adding OTI T cells (OTI) in a 1:1 effector-to-target ratio. Cells were harvested 24 h after T cell addition and stained for flow cytometric analysis, or (F) tumor cells were harvested 6 and 24 h after OTI addition and stained for flow cytometric analysis of MHC-I and PD-L1 expression. (G) Mean fluorescence intensity (MFI) was determined from the same samples. All data are presented as mean + SEM of triplicate experiments, and statistical significance was determined by student’s t-test (* p < 0.05, ** p < 0.01, *** p < 0.001). (H) Labeled OTI T cells were used in co-culture experiments to visualize accumulation around VSV-NDV-induced syncytia. B16-OVA cells were treated with PBS (left panel) or infected with VSV-NDV-GFP at MOI 0.01 for 16 h (middle and right panel), and OTI T cells labelled with FarRed CytoTrace (ThermoFischer) were added. Representative pictures were taken 4–6 h later under 100× (left and middle) or 400× (right) magnification. Composites were generated using ImageJ.

