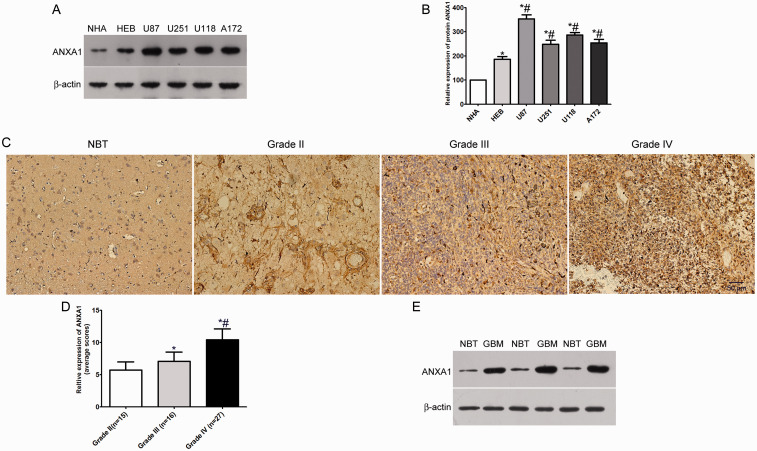
Figure 1.
ANXA1 Expression Levels in Glioma Cells and Glioma Patients. A: Western blotting analysis of the expression levels of ANXA1 in human astrocytes (NHA and HEB) and glioma cell lines (U87, U251, U118 & A172). B: Quantification of the protein bands as shown in (A), *p < 0.05 compared with NHA cells, #p < 0.05 compared with HEB cells. C: Representative immunohistochemistry images show that ANXA1 is more highly expressed in glioma tissues than in non-tumor brain tissues (NBT). Stronger stain intensity and higher stain density exist in glioblastoma tissues than those in non-tumor brain tissues. D: ANXA1 expression levels in glioma patients with different grades, *p < 0.05 compared with Grade I group, #p < 0.05 compared with Grade II group. E: Western blot assays of ANXA1 expression in 3 non-tumor brain tissues (NBT) and 3 primary glioblastoma (Grade IV) tissues.

