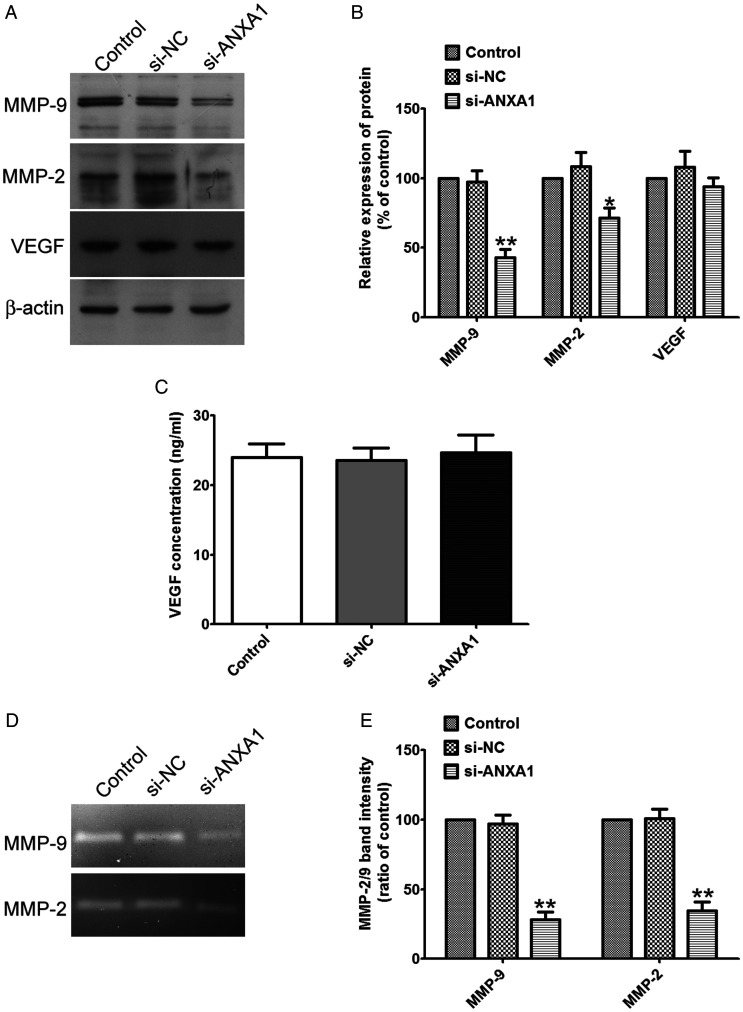
Figure 7.
Knockdown ANXA1 Down-Regulates the Expression and Activity of MMP-2/-9. A: Western blot analysis of total cell lysates isolated from glioma cells after si-ANXA1 or si-NC treatment by using the anti-MMP9, anti-MMP-2 and anti-VEGF antibodies. B: Quantitative charts of the protein levels of MMP2/9 and VEGF normalized to β-actin bands respectively. Data were expressed as the mean ± SD from three independent experiments. C: U87 cells were planted (3 × 10⁵ cells/well) in 24-well plates, after reaching 90% confluence, the cells were transfected with si-ANXA1 or si-NC, the secreted VEGF protein was then measured in the supernatants by ELISA. Data are presented as ng/mL VEGF (mean ± SD, n = 5 wells per condition). D: U87 cells were planted (3 × 10⁵ cells/well) in 24-well plates, after reaching 90% confluence, the cells were transfected with si-ANXA1 or si-NC, the activity of MMP-2 and MMP-9 was then measured by gelatin zymography. E: Quantitative intensities of MMP-2/-9 bands of relative histograms are shown. Data are expressed as the mean ± SD from four independent experiments, *p < 0.05 compared withsi-NC group.

