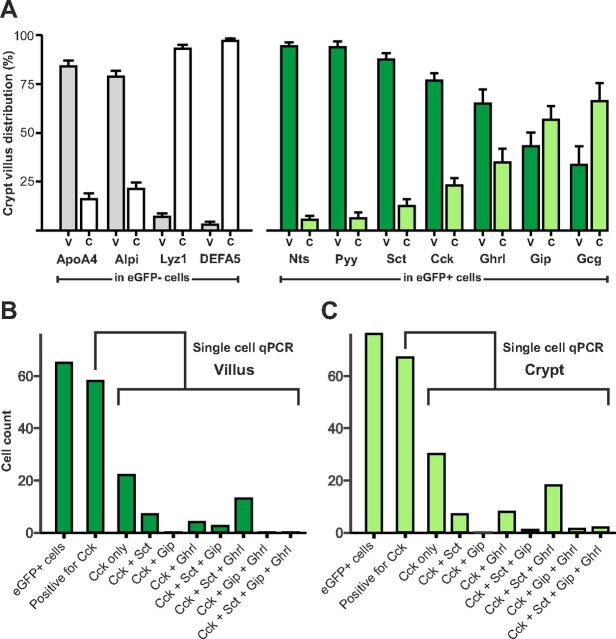
Fig. 4.
Relative expression of RNAs encoding peptide precursors in FACS-sorted populations of CCK-eGFP-positive cells isolated from villus (V) vs. crypt (C) fractions from duodenum of CCK-eGFP transgenic mice. Populations of cells derived from villus vs. crypts were obtained by collecting cells early vs. late, respectively, during the enzymatic release of cells from the duodenal mucosa (see Material and Methods for details) Panel A (to the left), The relative expression of markers for intestinal villus (Alpi and Apoa4 from enterocytes) and crypt (Lyz1 and Defa5 from Paneth cells) in the CCK-eGFP-negative cells derived from villus (V, gray columns) vs. crypt (C, white columns). Panel A (to the right), The relative expression for the gut hormones: Nts, Pyy, Sct, Cck, Ghrl, Gip, and glucagon/GLP-1 (Gcg) in CCK-eGFP-positive cells derived from villus (V, dark green) vs. crypt (C, light green). The gene expression is indicated as percentage of total, i.e. crypt plus villus. It should be noted that although the actual total expression in the CCK-eGFP-positive cells is relatively high for Cck, Sct, Gip, and Ghrl it is relatively low for Gcg, Pyy, and Nts (see Fig. 2B) the total is here indicated as 100%. Panel B and C, Single-cell QPCR (see legend to Fig. 3) of cells derived from the villus and crypt, respectively. The numbers of cells positive for Cck, Sct, Gip, and ghrelin are given, in this unamplified QPCR analysis a Ct value <40 is considered to be positive for expression of the peptide precursor RNA (see Materials and Methods).

